Using alerts in Velociraptor
The alert() function routes a message
into the
Server.Internal.Alerts
event queue. It is intended for high-value, low-frequency events: a
detection artifact found a match, a honey file was accessed, a network
connection to a known malicious host is initiated.
Unlike log(), which records
diagnostic information in the artifact’s own log, alert messages are
collected centrally on the server and can be acted on by a server
event artifact such as
Server.Monitor.Alerts,
which forwards them by e-mail.
Creating an alert
Alerts can be created from anywhere where VQL can be executed: notebooks, client artifacts, server artifacts, event artifacts, the API or the CLI.
Call alert() the same way as
log():
SELECT alert(
    name="The alert title/message",
    FileName=FileName,
    ProcessName=Process.Name,
    Pid=Process.Pid
)
FROM ...
The name argument is required. All other keyword arguments (except
for dedup and condition) are passed through as context and appear
in the notification. The more relevant context you add, the more
useful the resulting notification will be.
Deduplication
By default, identical alert names are suppressed for 2 hours
(dedup=7200). Set dedup=-1 to disable deduplication entirely, or
set a shorter interval when testing.
Say you are alerting on a detection. If the alert name includes the client ID or hostname, you will get one alert per client within the deduplication window. If it also includes the detected item (e.g. a filename), you will get a new alert when a different item is detected on the same client in the same window.
What to use alert() for
Only a few built-in artifacts call alert() (such as
Windows.Events.Mutants and Windows.Detection.Registry), and very
few published exchange artifacts do. There is no rule against
publishing artifacts that use alerts, but keeping the alert logic in
separate monitoring artifacts gives you full control over what
triggers a notification and what context it includes.
Detection monitoring artifacts are a natural fit, since you probably want to be notified immediately if an IoC is detected through client monitoring.
For operational problems (event query errors, failing artifacts), use the dedicated error-monitoring artifacts. See How to monitor event artifact errors.
Calling alert() from inside a client event artifact
The simplest approach is to call alert() directly in the artifact
that detects the condition. When a client event artifact calls
alert(), the VQL runtime scope already contains client_id,
artifact, and artifact_type. Server.Monitor.Alerts reads these
from the scope and uses them to populate the notification with client
details and artifact information automatically, with no extra work on
the caller’s part.
Calling alert() from a server event artifact
If you do not want to modify an existing artifact, write a server
event artifact that watches the source artifact’s output with
watch_monitoring() and
calls alert(). Because the alert then originates from the server
event artifact, the scope’s client_id is “server” and artifact is
the wrapper artifact’s name. To make the notification show the
original source instead, pass ClientId, Artifact, and
ArtifactType explicitly in the alert() call.
Server.Monitor.Alerts prefers these values from event_data over
its own scope. See the
Server.Monitor.Alerts description
for the full list of overridable fields.
Examples
Honey file access
A client event artifact monitors decoy files using the exchange
artifact
Linux.Detection.Honeyfiles.
A server event artifact listens to events from this artifact and
creates an alert for every file access:
name: Server.Monitor.HoneyfileAccess
description: |
  Create an alert every time a honey file is accessed on a client.

  The alert name includes the client's FQDN and the file name accessed, so
  deduplication is performed per client.

type: SERVER_EVENT

sources:
  - query: |
      SELECT
          alert(
            name=format(
              format='Honey file "%v" accessed on %v',
              args=(FileName, client_info(client_id=ClientId).os_info.hostname)),
            ClientId=ClientId,
            Artifact="Linux.Detection.Honeyfiles",
            ArtifactType="CLIENT_EVENT",
            Level="HIGH",
            `File name`=FileName,
            PID=Pid,
            `Process name`=ProcessName,
            `Process info`=ProcInfo)
      FROM watch_monitoring(artifact="Linux.Detection.Honeyfiles")
As mentioned above, the client ID and artifact details are overridden
so that it appears as if the alert originates from the client event
artifact rather than this server event artifact. An alternative is to
modify the original artifact and call alert() directly.
The resulting e-mail will look something like this:
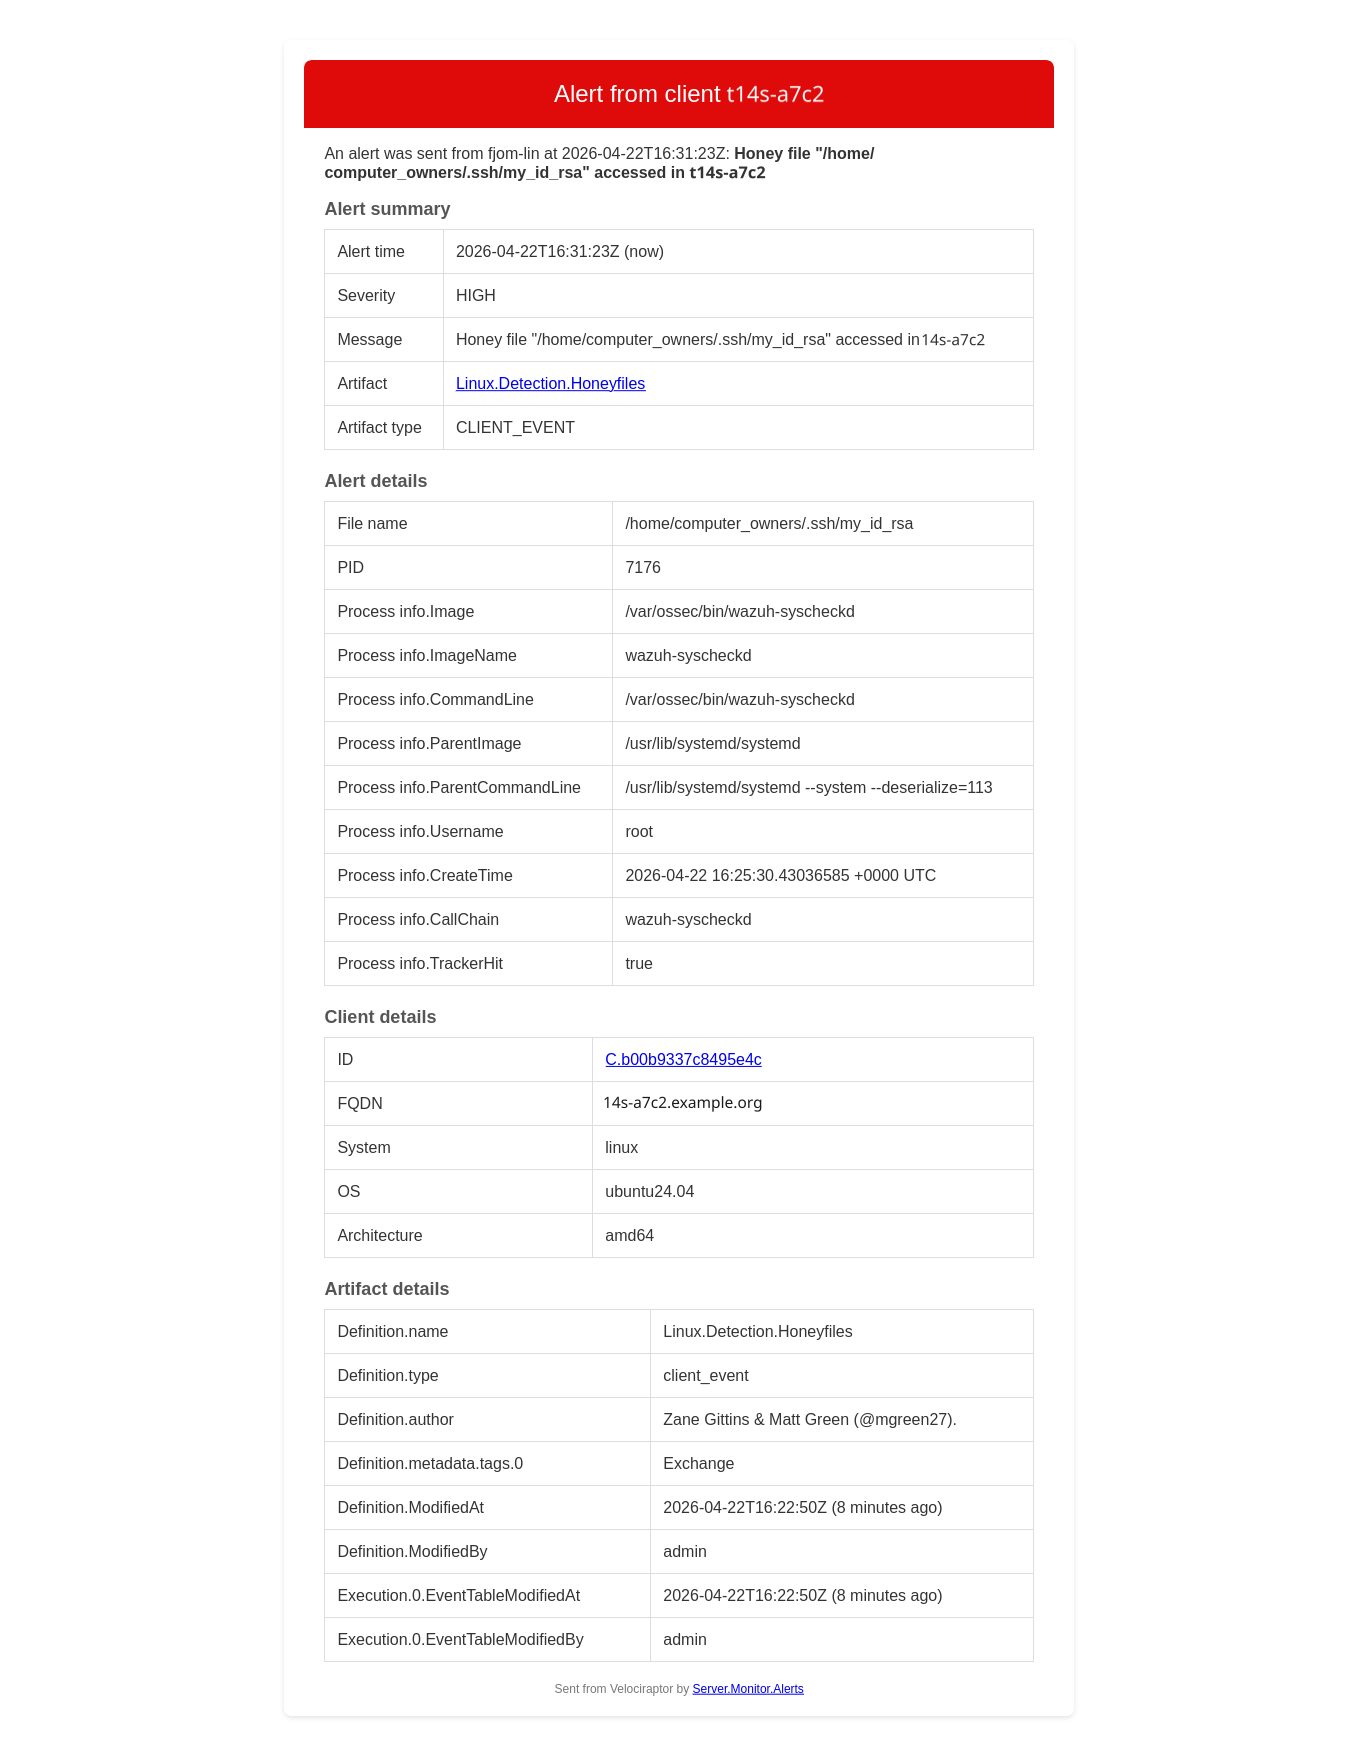
Since the client hostname is part of the alert name, deduplication
happens per client. If you want to deduplicate only on the file name,
remove the client hostname from the alert name.
The artifact information provided in the screenshot is normally not interesting, and is opt-in. It is useful when debugging artifact errors.
Sigma or YARA detection hits
A server event artifact watches results from a Sigma or YARA artifact and
alerts on matches. ClientId is passed explicitly to replace the default
"server":
SELECT alert(
    name=Title,
    dedup=300,
    ClientId=ClientId,
    Artifact="Sigma.Windows.Hayabusa.Monitoring",
    ArtifactType="CLIENT_EVENT",
    Level=Level,
    Channel=Channel,
    EID=EID,
    Details=Details
)
FROM watch_monitoring(artifact="Sigma.Windows.Hayabusa.Monitoring")
WHERE Level =~ "(?i)high|critical"
Other good candidates:
- Network connections to known malicious IP addresses
- Process execution from temp directories or other unusual paths
- Writes to registry persistence locations (run keys, services)
- DNS queries to known bad domains
- Repeated authentication failures exceeding a threshold
- New local administrator accounts created
Adding context
Any keyword arguments passed to alert() beyond name, dedup and
condition are available in event_data when the alert is received
by Server.Monitor.Alerts. Pass whatever fields help identify the
event. The more context, the more useful the notification:
SELECT alert(
    name="Suspicious network connection",
    dedup=300,
    RemoteAddr=RemoteAddr,
    LocalAddr=LocalAddr,
    Pid=Pid,
    ProcessName=ProcessName,
    CommandLine=CommandLine
)
FROM ...
If a context field contains a nested dict or array, Server.Monitor.Alerts
flattens it with FlattenContext (on by default). A single Details argument
containing a complex nested value:
| Key | Value |
|---|---|
| Details | {“EventID”: 1, “Image”: “C:\Windows\System32\WindowsPowerShell\v1.0\powershell.exe”, “Hashes”: {“SHA256”: “A1B2C3D4E5F60718293A4B5C6D7E8F90123456789ABCDEF0011223344556677”}, “Parent”: {“Image”: “C:\Windows\explorer.exe”, “ProcessId”: 4120}, “Connections”: [{“DestinationIp”: “198.51.100.42”, “DestinationPort”: 443}]} |
becomes:
| Key | Value |
|---|---|
| Details.EventID | 1 |
| Details.Image | C:\Windows\System32\WindowsPowerShell\v1.0\powershell.exe |
| Details.Hashes.SHA256 | A1B2C3D4E5F60718293A4B5C6D7E8F90123456789ABCDEF0011223344556677 |
| Details.Parent.Image | C:\Windows\explorer.exe |
| Details.Parent.ProcessId | 4120 |
| Details.Connections.0.DestinationIp | 198.51.100.42 |
| Details.Connections.0.DestinationPort | 443 |
Including all columns from the source query
If you want to include every column from the source query (e.g. because the columns may differ), you can write something like
LET Results = SELECT *
  FROM watch_monitoring(artifact="My.Client.Event.Artifact")

SELECT
    alert(`**`=to_dict(item=_value) + dict(name="(The alert name)",
                                           Severity="medium"))
FROM items(item=Results)
This uses
argument unpacking. Note
the order of the dict addition: by adding the dict with name and
Severity to the query values (and not the other way around), we
ensure that these required arguments are not overridden by columns of
the same name in the source query.
You should also consider filtering the columns with
column_filter() if you want
to exclude certain columns or ensure that only relevant columns are
included:
LET Results = SELECT *
  FROM watch_monitoring(artifact="My.Client.Event.Artifact")

SELECT
    alert(`**`=to_dict(item=_value) + dict(name="(The alert name)",
                                           Severity="medium"))
FROM items(item={
    SELECT *
    FROM column_filter(query=Results, exclude='^(foo|bar|baz)$')
  })
Receiving alerts
Alerts on their own are not useful unless you get notified. There are many ways to achieve this — for instance, by calling a web hook or an API to create notifications in services like Slack, Mattermost, Teams or Google Chat. The two methods covered here are e-mail and in-app user messages. Look through the artifact documentation, including the exchange artifact reference, for other notification artifacts.
By e-mail
Server.Monitor.Alerts
watches Server.Internal.Alerts and sends an e-mail for each matching
alert. If your server has internet access, run
Server.Import.Extras
to import it. Then add it as a server event artifact and point it at
your SMTP secret.
Key parameters:
| Parameter | Description |
|---|---|
Secret |
SMTP secret name (required) |
Recipients |
Who to notify |
SeverityTransforms |
Derive a normalized severity string from context fields |
SeverityThreshold |
Only notify for alerts at or above a given severity |
ContextInclude/ContextExclude |
Control which context fields appear in the notification |
FlattenContext |
Flatten nested dicts in the context for readability |
Severity
severity and level are not special fields. They are just free-form
keyword arguments passed to alert() like any other context.
Server.Monitor.Alerts gives them meaning through
SeverityTransforms: it reads named fields from the context and maps
their values to a normalized severity string. If your alert context
already includes a field like level or severity (for instance from
a Sigma rule), you can map it to a common scale. For example:
Member,Regex,Replace
level,(?i)warning,medium
level,(?i)critical,high
Set SeverityThreshold to ["medium", "high"] to suppress
low-severity alerts. The derived severity appears in the notification
subject and body.
As in-app user messages
Server.Monitor.Alerts.UserMessage
is a simple artifact that posts each matching alert as an in-app user
message in addition to (or instead of) an e-mail. Logged-in users see
the notification when they open the message panel from the bell icon
in the lower-left corner of the web app. The bell turns red when there
are unread messages, and the list can be cleared from the panel.

The artifact filters by Recipients (regex on usernames) and
RecipientRoles (regex on roles, defaulting to admin), so only
the relevant users are notified. AlertMsgInclude and
AlertMsgExclude further narrow which alerts are forwarded.
The message itself is simple and is just a sender
(VelociraptorServer) and a single Message column rendered as a
nested dict. HTML e-mails support richer formatting, and
Server.Monitor.Alerts
provides additional tables with client, flow and artifact details.
Use the in-app notifications in order to get immediate attention to alerts while using the Velociraptor GUI, and e-mail notifications to get a solid amount of information about the alert and its origin when not using the app.
See also
- Create a server-side alert:
alert() - Forward alerts by e-mail:
Server.Monitor.Alerts - Forward alerts as in-app messages:
Server.Monitor.Alerts.UserMessage - How to send e-mails from Velociraptor
- How to set up e-mail notifications for flow completions
- How to monitor event artifact errors
- Alerts and e-mail notifications in Velociraptor