Debugging Velociraptor
Like any piece of software, Velociraptor makes a number of engineering trade-offs, and may encounter some error conditions or even bugs. When faced with the prospect of an unresponsive server or client, or high CPU load, users often ask: “What is Velociraptor doing right now?”
To see the inner workings of Velociraptor we can collect profiles of various aspects of the program. These profiles exist regardless of whether Velociraptor is being run as a client or server or even an offline collector.
You can read more about profiling in our blog article Profiling the Beast.
Collecting Profiles
Without appropriate ways to ask Velociraptor what is happening internally, one would need to attach a debugger to understand what is happening. To help users see inside the ‘black box’ of Velociraptor, we have implemented extensive Debugging Profiles which allow us to inspect the state of the various sub-systems inside the program.
Making Velociraptor’s inner workings transparent helps to explain to users how it actually works, what trade-offs are made and why the program might not be behaving as expected.
Profiles are views into specific aspect of the code. You can collect
profiles from the local server using the Server.Monitor.Profile
artifact or from remote clients using Generic.Client.Profile.
Collecting these artifacts gives a snapshot or a dump of all profiles at a specific instant in time.

If you encounter an issue that requires more thorough inspection, you can seek assistance from the community on Discord or the mailing list. In this case, you will probably be asked to attach a profile to your request. This helps the developers to understand issues within the system.
Simply collect the relevant artifact (either from the server with
Server.Monitor.Profile or a client with Generic.Client.Profile)
and export the collection into a zip file from the GUI. You can then
send us the Zip file for analysis.
The Debug Console
While collecting profiles using an artifact is useful to take a snapshot of the current process status, it is not very convenient when we want to see how the process evolved over time.
To help with this, Velociraptor has a Debug Console GUI that provides a live view of the debugging profiles.
On the server the Debug Console is always available by default. You can access it from the main Welcome page. For clients and offline collectors please see the sections below which explain how to enable it in those modes of operation.

This link opens the main page of the Debug Console.

Starting the Debug Console on clients
Unlike on the server, on clients the Debug Console is not enabled by default for security reasons.
To allow debugging of a client issue you can start the Debug Console by adding
the --debug flag to the service’s command line. If the client is installed as
a service then you will need to stop the service first, and then run it manually
from the command line as follows:
sudo systemctl stop velociraptor_client.service
/usr/local/bin/velociraptor_client --config /etc/velociraptor/client.config.yaml client -v --debug
sc.exe stop velociraptor
velociraptor.exe client --config "C:/Program Files/Velociraptor/client.config.yaml" -v --debug
sudo launchctl unload /Library/LaunchDaemons/com.velocidex.velociraptor.plist
sudo /usr/local/sbin/velociraptor client --config /usr/local/sbin/velociraptor.config.yaml -v --debug
When provided with the --debug flag, Velociraptor will start the Debug Console
on port 6060 (use --debug_port if you need to specify a different port). By
default the Debug Console will only bind to localhost so you will need to either
tunnel the port or use a local browser to connect to it.
Debugging the offline collector
The offline collector is a “one shot” collector which simply runs, collects several preconfigured artifacts into a zip file and terminates.
Sometimes the collector may, for example, take a long time or use too much memory. In this case you might want to gain visibility into what it’s doing.
You can start the offline collector by adding the --debug flag to its
command line.
Collector_velociraptor-v0.75.2-windows-amd64.exe -- --debug --debug_port 6061
Note that the additional -- is required to indicate that the additional
parameters are not considered part of the command line (the offline collector
requires running with no parameters).
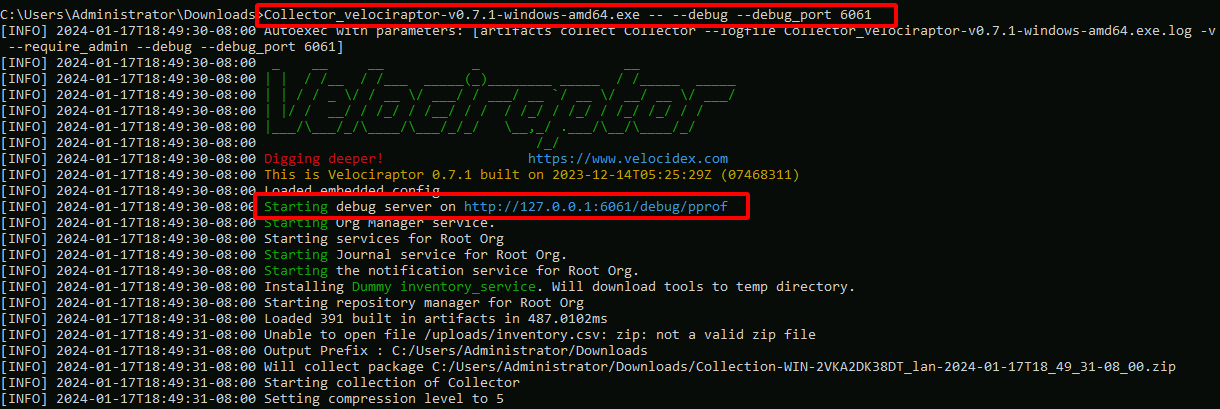
The above will start the Debug Console on port 6061 which you can access with a web browser. You can then download goroutine, heap allocation and other profiles from the debug server and forward these to the Velociraptor development team to identify and resolve any issues.
If you have preconfigured the offline collector to close upon completion without
prompting and it completes before you are finished in the Debug Console, then
you can add --prompt to the command line to keep the application running. For
example:
Collector_velociraptor-v0.75.2-windows-amd64.exe -- --debug --prompt
Profile types
The following pages provide additional details on each profile type. It is instructive to read about each profile item to understand how Velociraptor works internally, understand the trade-offs made, and how to get the most out of Velociraptor in the real world.
- Internal
- Metrics
The internal profiles are built in profiles provided by the Golang ecosystem. They are mostly useful for developers but can be collected for Velociraptor as well.
Metrics are counters in the program that are used to collect high level statistics about program execution.
Metrics are also exported on the server using the Metrics Server. This is controlled in the configuration file Monitoring
section:
Monitoring:
 bind_address: 127.0.0.1
 bind_port: 8003
 metrics_url: http://localhost:8003/metrics
On the server, you can collect monitoring data using curl:
- Metrics
Metrics are counters in the program that are used to collect high level statistics about program execution.
Metrics are also exported on the server using the Metrics Server. This is controlled in the configuration file Monitoring
section:
Monitoring:
 bind_address: 127.0.0.1
 bind_port: 8003
 metrics_url: http://localhost:8003/metrics
On the server, you can collect monitoring data using curl:
curl http://localhost:8003/metrics
Monitoring data is not exposed by the client.
The data is provided in a standard way to interface to various scrapers, such as Prometheus, Grafana or Datadog. We encourage deployments to use this data to build health dashboards and service alerts. Although inspecting this data manually can also provide valuable insight.
These show the built in Golang profiles. These profiles provide detailed instrumentation of the running process.
This type of information is critical for developers to understand what the code is doing, and is therefore often required in any bug reports or discussions of suspected bug with the Velociraptor developer team.
These can be accessed via the link Internal -> Show built in Go Profiles in
the Debug Console.
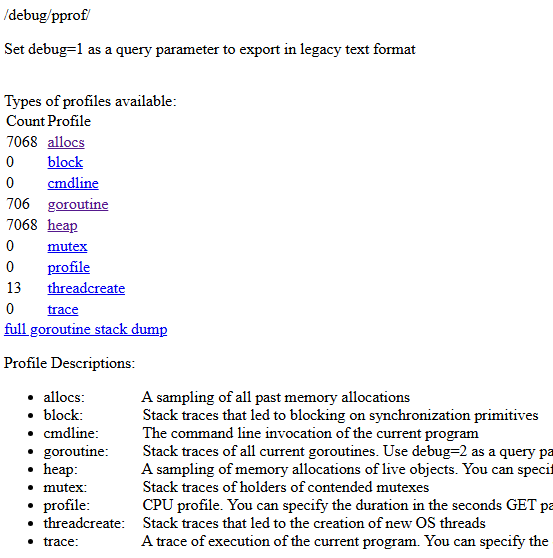
These profiles only exist on the client. You can see those in the
debug server by adding the --debug flag (you can also add the
--debug_port flag to set a different port). The client will by
default serve the debug server over http://localhost:6060/.
- Monitoring
- Monitoring
- Flows
- The flow id is used to identify the flow.
- The duration of the collection since it was last started
- How many bytes were uploaded to the server?
- How many rows were returned to the server?
- Global
- Datastore
- Replication
- Replication
- Services
- ExportContainers
- Datastore
- Replication
- Services
- ExportContainers
- VQL
- Queries
- Active Queries
- Org
- Services
- Broadcast
- QueueManager
- VFS
- Notifier
- Services
- Broadcast
- QueueManager
- VFS
- Notifier
The client monitoring profile shows current information on the client event monitoring subsystem.
Clients receive a Client Event Table update from the server,
instructing them on a set of CLIENT_EVENT artifacts to run. The
results from these artifacts are streamed back to the server in
near-realtime.
Client event queries are stored in the client’s writeback file so
they can start immediately as soon as the client boots, even if it is
not connected to the server or offline. While offline the results are
buffered locally to a file, and then synced with the server at the
next opportunity.
The Client Flows profile shows information about currently executing collections on the endpoint. It is most interesting to collect when another flow is executing on the endpoint.
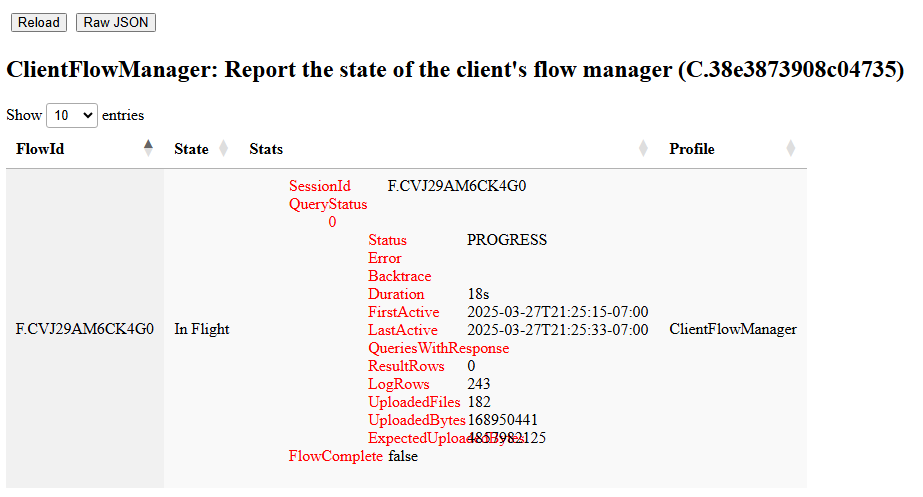
The profile shows the progress of the collection on the endpoint:
These are generally the same stats the server keeps but are from the point of view of the client.
Profiles related to the server’s datastore.
Reports current replication connections between master and minion.
Reports current replication connections between master and minion.
Velociraptor contains many service modules that help the process perform certain tasks. These usually contain specific profiles to show how they are performing.
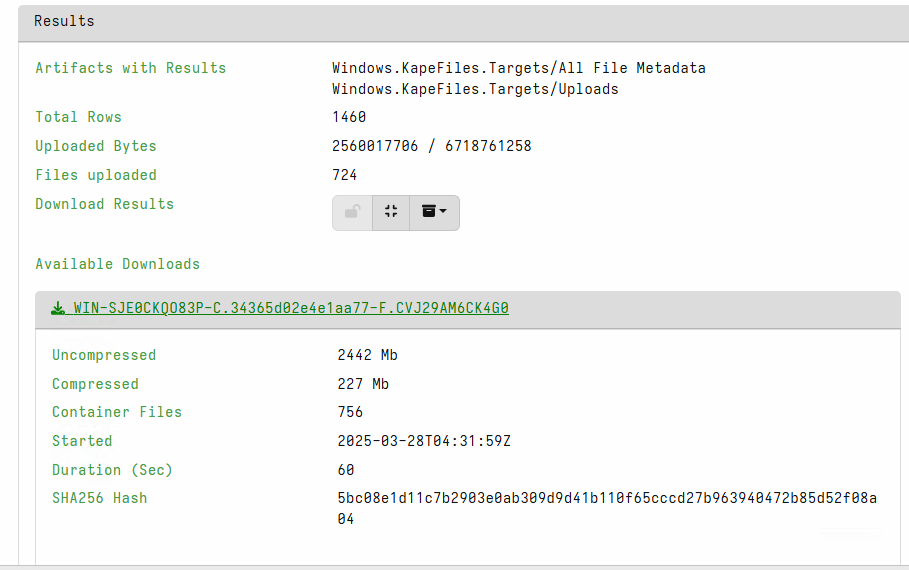
The Velociraptor GUI allows exporting collections from Flows or Hunts into a Zip file. If the collection is very large this can take some time. While the GUI shows some progress information:
Profiles related to the server’s datastore.
Reports current replication connections between master and minion.
Velociraptor contains many service modules that help the process perform certain tasks. These usually contain specific profiles to show how they are performing.
The Velociraptor GUI allows exporting collections from Flows or Hunts into a Zip file. If the collection is very large this can take some time. While the GUI shows some progress information:
See currently and recently running VQL queries.
This view shows the queries currently running in this process. For example queries will run as part of notebook evaluation, currently installed event queries, or currently collecting artifacts (in the case of the offline collector).
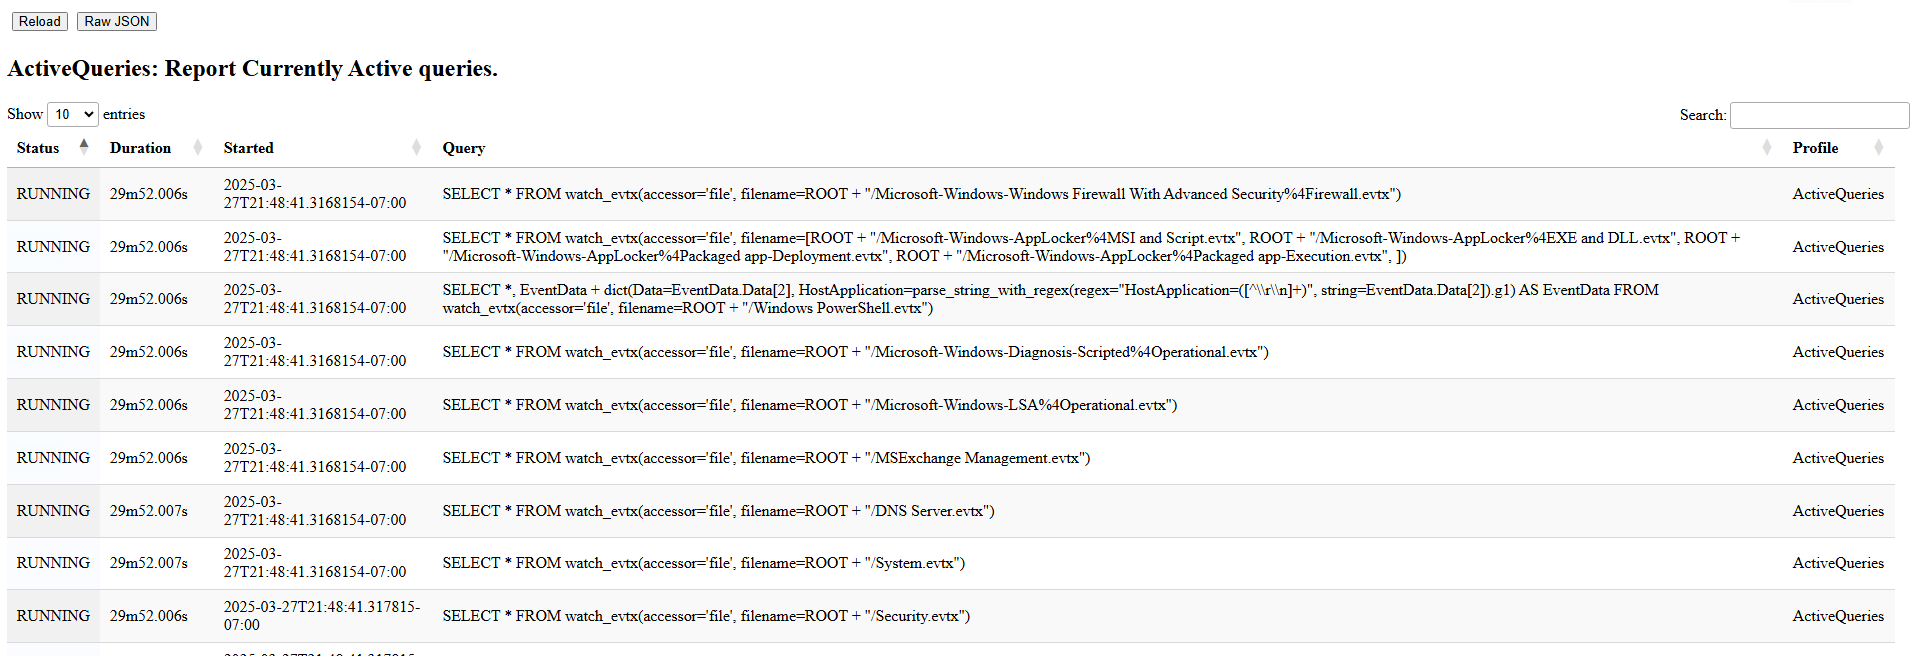
The above example shows a number of queries watching a variety of
event logs on the endpoint. This is because this endpoint is running
the Windows.Hayabusa.Monitoring artifact, which evaluate many Sigma
rules, many referring to different log sources. Each log source relies
on parsing the event logs.
Profiles for services associated with each org.
Track generators installed via the generator() plugin.
Report the current states of server artifact event queues.
The VFS service post processes results from VFS operations.
Information about directly connected clients.
Track generators installed via the generator() plugin.
Report the current states of server artifact event queues.
The VFS service post processes results from VFS operations.
Information about directly connected clients.