VQL
- Queries
- Active Queries
- Active Queries
- Plugin Monitor
- Recent Queries
- Plugins
- ETW
- Glob
See currently and recently running VQL queries.
This view shows the queries currently running in this process. For example queries will run as part of notebook evaluation, currently installed event queries, or currently collecting artifacts (in the case of the offline collector).
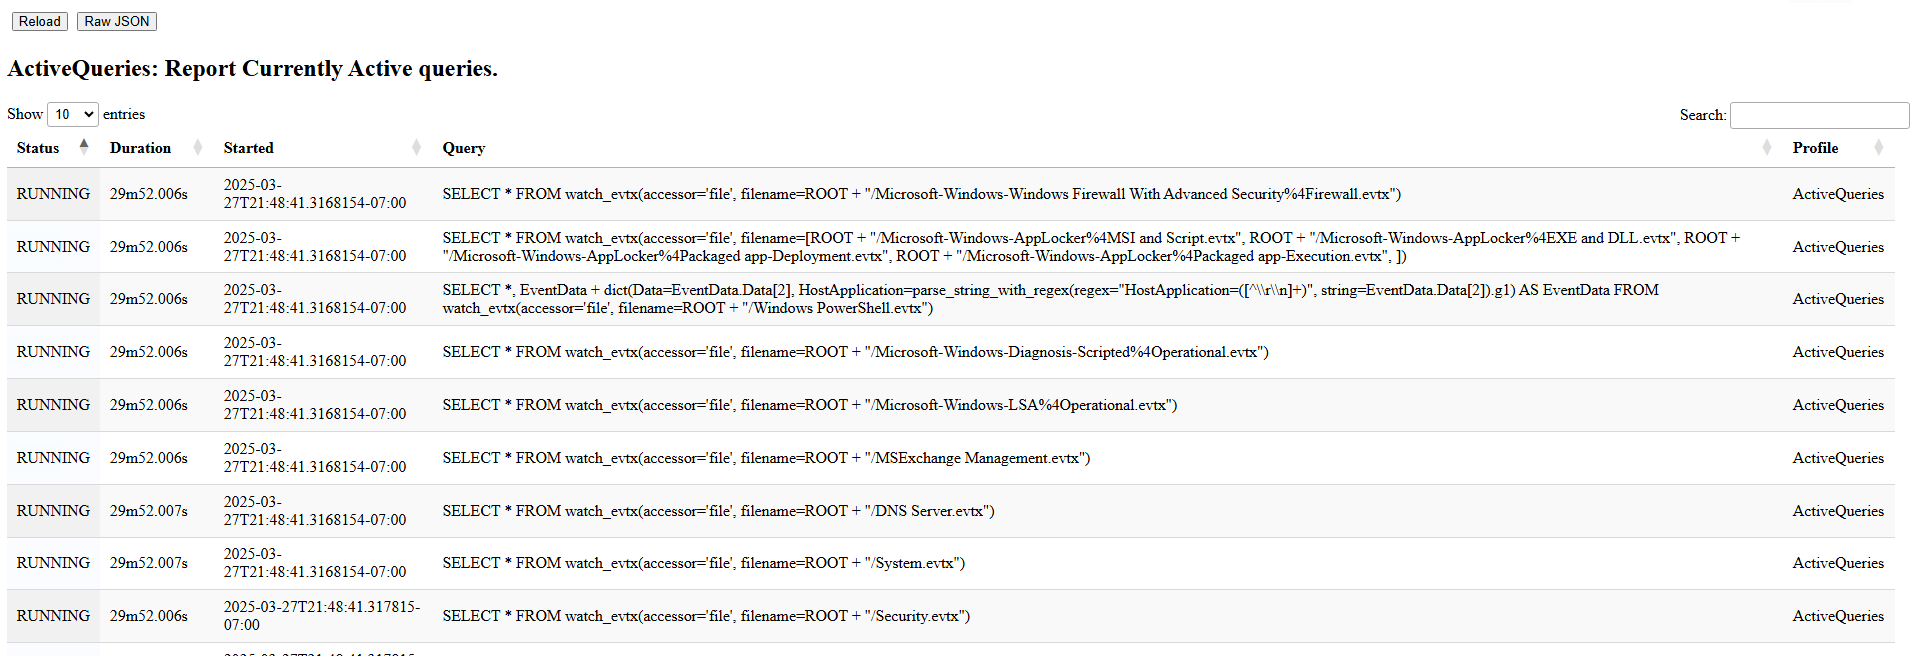
The above example shows a number of queries watching a variety of
event logs on the endpoint. This is because this endpoint is running
the Windows.Hayabusa.Monitoring artifact, which evaluate many Sigma
rules, many referring to different log sources. Each log source relies
on parsing the event logs.
This view shows the queries currently running in this process. For example queries will run as part of notebook evaluation, currently installed event queries, or currently collecting artifacts (in the case of the offline collector).
The above example shows a number of queries watching a variety of
event logs on the endpoint. This is because this endpoint is running
the Windows.Hayabusa.Monitoring artifact, which evaluate many Sigma
rules, many referring to different log sources. Each log source relies
on parsing the event logs.
At their core VQL queries process rows emitted from VQL plugins. We have seen previously the Active Queries tracker which provides information on currently running queries.
However it is also useful to know what plugins are currently running and what parameters are used within them. This gives us a really good idea what the VQL engine is doing exactly at the moment.
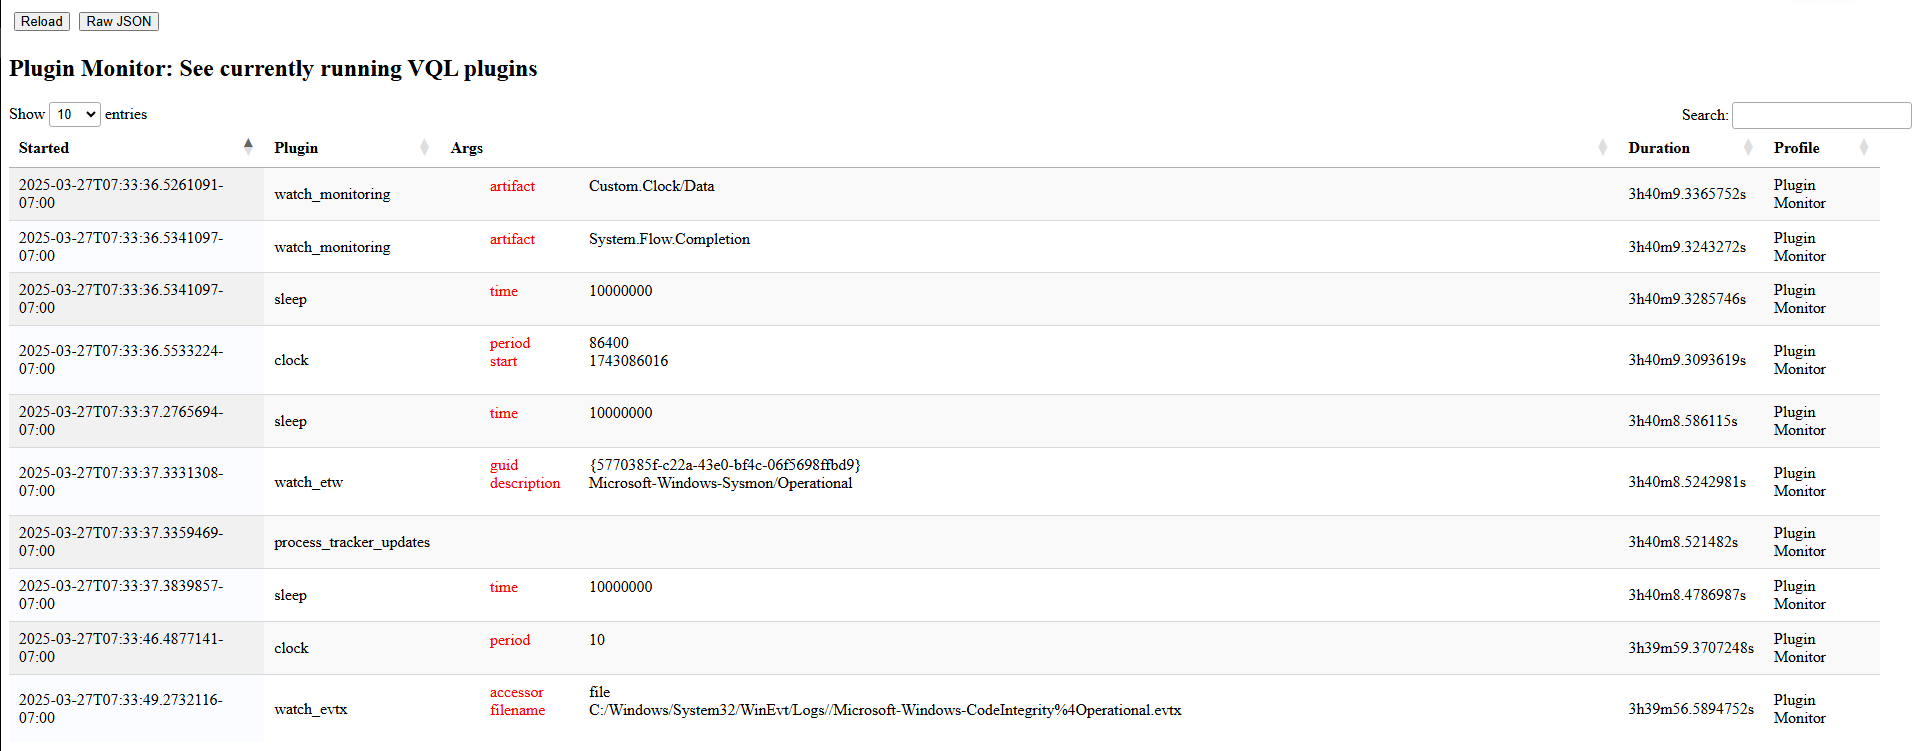
The above example show the plugins currently active. We see a few
instances of watch_monitoring(). Another instance of watch_etw()
plugin is seen watching the Sysmon ETW stream. Finally we see some
instances of watch_evtx() watching various event logs.
The Recent Queries profile similarly shows all recent queries (even
after they completed). This helps us understand what queries had run
on the endpoint previously, and how long they took to complete.
In the VQL profile category there are also profiles to show all recent queries
(even ones that have completed already). This helps us to understand what
exactly the client was recently doing.
Much of Velociraptor functionality is implemented using VQL plugins. Some plugins are very sophisticated and require their own profile tracking.
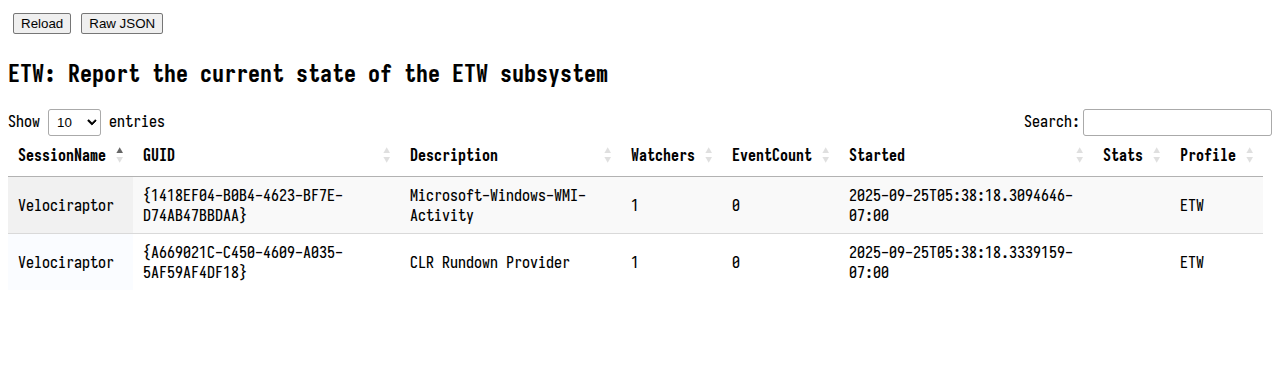
This profile shows the current state of the ETW subsystem on Windows. We can see what providers Velociraptor is subscribed to, how many queries are currently watching that provider, and how many events were received from the provider.
Event Tracing For Windows (ETW) is a powerful source of system
information available on Windows. Velociraptor allows subscribing to
the ETW streams using the watch_etw() plugin.
Velociraptor is often used to search for files. This is commonly done
using the glob() plugin. This plugin is highly optimized to speed up
searching through various filesystems.
However, sometimes it is hard to know what the plugin is doing. For example a query such as:
SELECT * FROM glob(globs='C:/**/*.foobar')
Will search for a file with a foobar extension. However, what if no
such file exists on the disk at all? In that case, although the
glob() plugin will enumerate every file on the disk, no results will
be returned and the query will appear to be blocked.
Track NTFS caches
Velociraptor has a built in Sigma rule evaluator, implemented with the sigma()
plugin. Sigma is an open standard for writing detection rules, with the
Velociraptor implementation described here.
Sigma rules rely on a log source, which in Velociraptor is a VQL
query. The rules also define detection clauses which apply on the
events emitted from the log source.
When a Sigma artifact is collected, the rules are loaded into the sigma evaluator, and all log sources referred to by the rules are started.
The Windows Event Logs contain windows events from various
sources. Velociraptor implements a parser to dump out all events from
a Windows event log file, but the watch_evtx() plugin can be used to
follow the log file as events are written to it.
This allows Velociraptor to analyze events in near real time, as they
are flushed into the log file. For example, the
Windows.Hayabusa.Monitoring artifact uses this functionality to
apply sigma rules on events in near real time.
Reference counting for open Zip files.
Report process tracker stats
SQLite files are used widely to store data in a structured file. We parse SQLite files using the Golang SQLite library.
Usually SQLite files implement file locking to coordinate multiple processes accessing the same file. This poses a problem for Velociraptor, which needs to read files currently opened by other applications (e.g. a currently running browser).
When Velociraptor attempts to open the SQLite file with the library, the open may fail if the file is locked. Similarly if Velociraptor opens a file which is in use by another application, the other application may fail to open it. Additionally, due to locking semantics access to the SQLite file while another application is trying to use it may be slow as rows and tables are locked and unlocked.