Queries
See currently and recently running VQL queries.
- Active Queries
- Plugin Monitor
- Recent Queries
This view shows the queries currently running in this process. For example queries will run as part of notebook evaluation, currently installed event queries, or currently collecting artifacts (in the case of the offline collector).
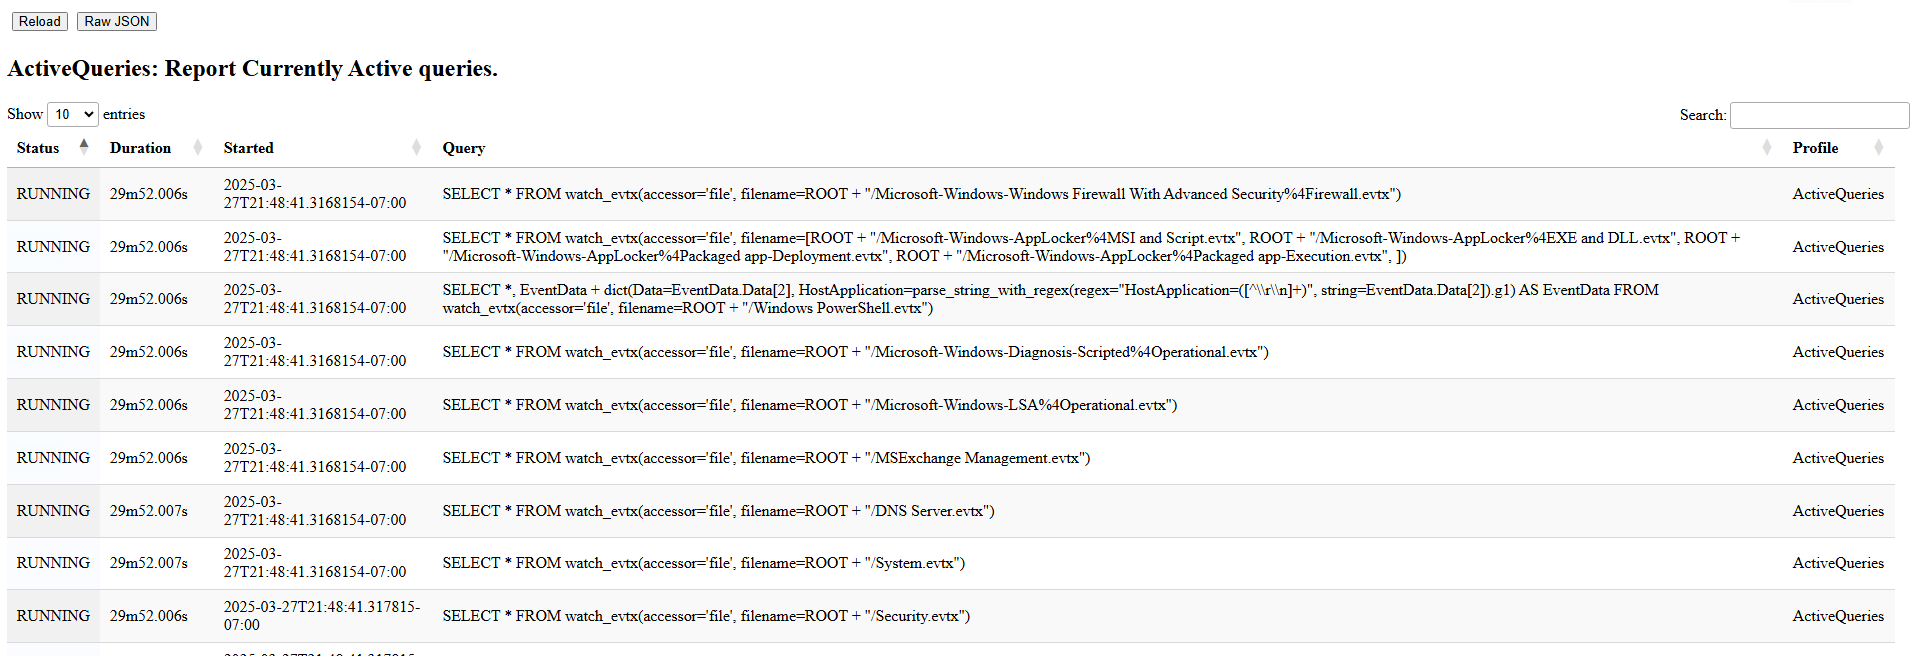
The above example shows a number of queries watching a variety of
event logs on the endpoint. This is because this endpoint is running
the Windows.Hayabusa.Monitoring artifact, which evaluate many Sigma
rules, many referring to different log sources. Each log source relies
on parsing the event logs.
At their core VQL queries process rows emitted from VQL plugins. We have seen previously the Active Queries tracker which provides information on currently running queries.
However it is also useful to know what plugins are currently running and what parameters are used within them. This gives us a really good idea what the VQL engine is doing exactly at the moment.
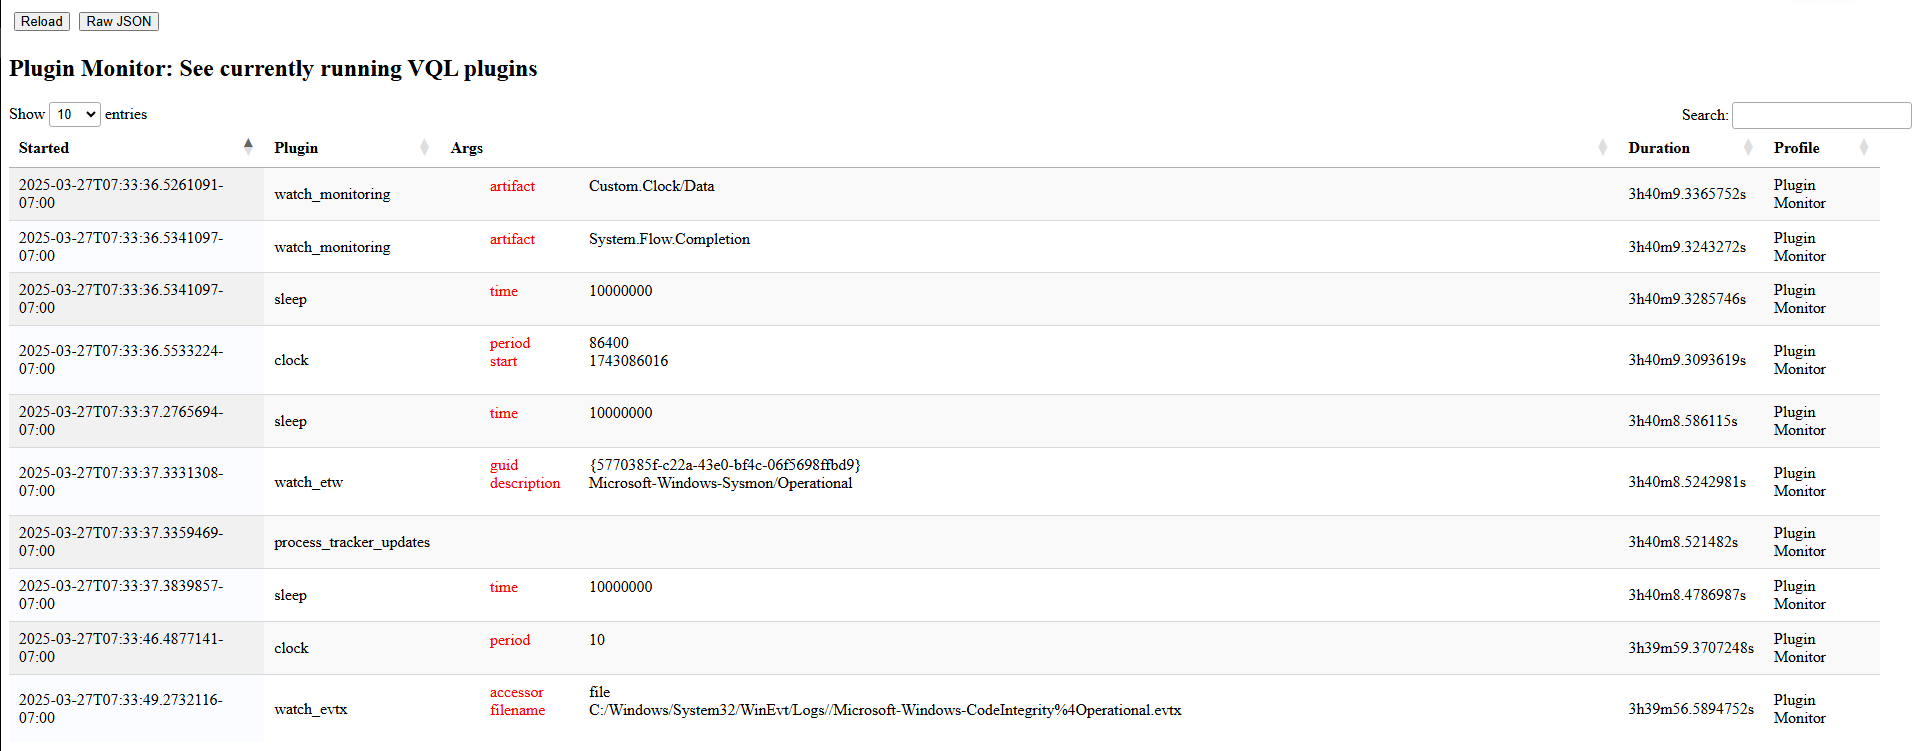
The above example show the plugins currently active. We see a few
instances of watch_monitoring(). Another instance of watch_etw()
plugin is seen watching the Sysmon ETW stream. Finally we see some
instances of watch_evtx() watching various event logs.
The Recent Queries profile similarly shows all recent queries (even
after they completed). This helps us understand what queries had run
on the endpoint previously, and how long they took to complete.
In the VQL profile category there are also profiles to show all recent queries
(even ones that have completed already). This helps us to understand what
exactly the client was recently doing.