Triaging Logs
Scenario
An endpoint is suspected of being compromised but you dont know exactly what happened. You want to get an initial idea by examining the logs on the actual endpoint.
Main takeaways
- This technique is similar to forwarding logs to a SIEM and applying signatures.
- However we can choose very noisy signatures here
- We use stacking to quickly categorize the types of activity that happens on the endpoint.
Steps to take
Some common artifacts that are used for Triaging Logs
Windows.Hayabusa.Rulesshould be imported usingServer.Import.CuratedSigmaExchange.Windows.EventLogs.Hayabusashould be imported from the artifact exchange.
Importing Windows.Hayabusa.Rules
- Select the
Server Artifactsfrom the sidebar. - Add a collection, search for
Server.Import.CuratedSigmaand import theWindows.Hayabusa.Rules. This will import the latest version of the artifact.
This artifact uses the built in Sigma Engine in Velociraptor. The
artifact packages the curated Hayabusa rules in a convenient
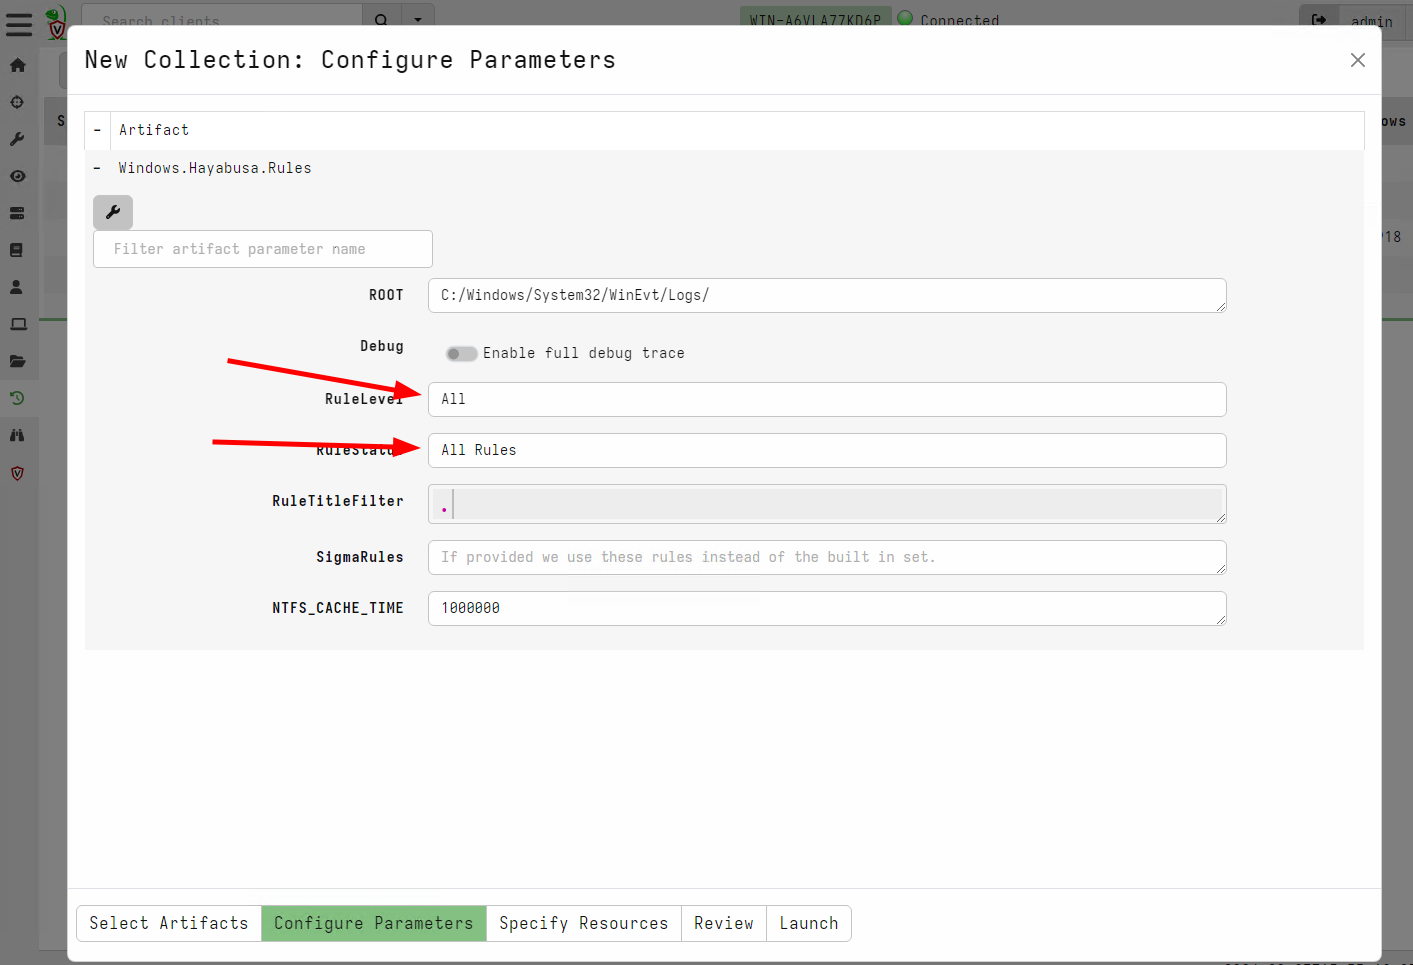
artifact. Rules are categorized by RuleLevel and RuleStatus which
generally try to balance how noisy a rule against its detection
efficacy.

Because we are trying to triage the endpoint, we actually want to see all the hits, even if they are noisy. We will apply stacking later to quickly triage the type of activity on the endpoint. So in this case we should select to apply all the rules.
Once the artifact is collected from the endpoint we can stack the hits in the GUI:
- Update the notebook to remove the
LIMIT 50. This will select all rows in one table. Typically there should be many thousands of rows because we added all the noisy rules. - Sort by the rule
Title. Hover the mouse on the column header and click theSortbutton. - Once the column is sorted, the stacking button should appear.
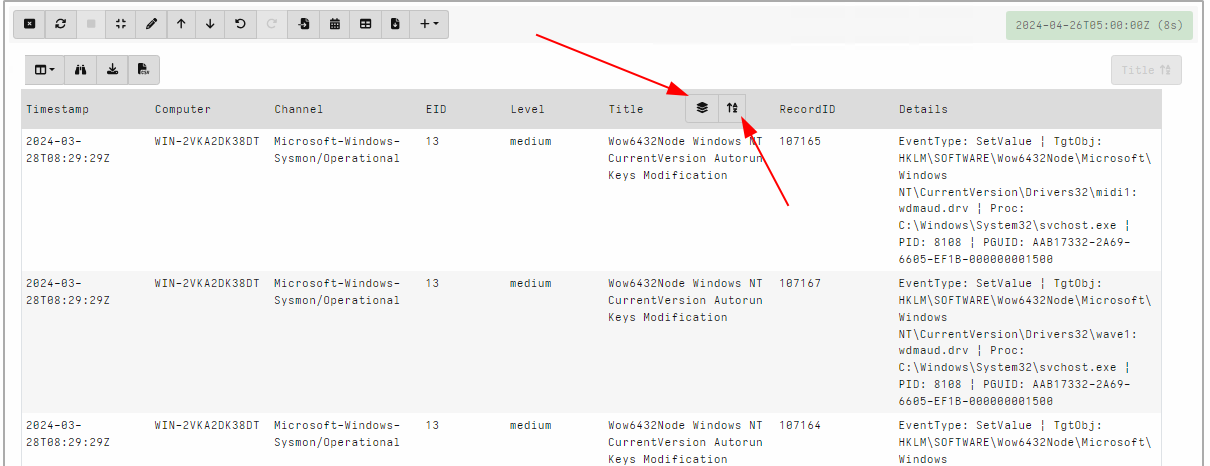
- Clicking the stacking button will show a summary of the different rules matching and a count of how many times each rule made a hit.
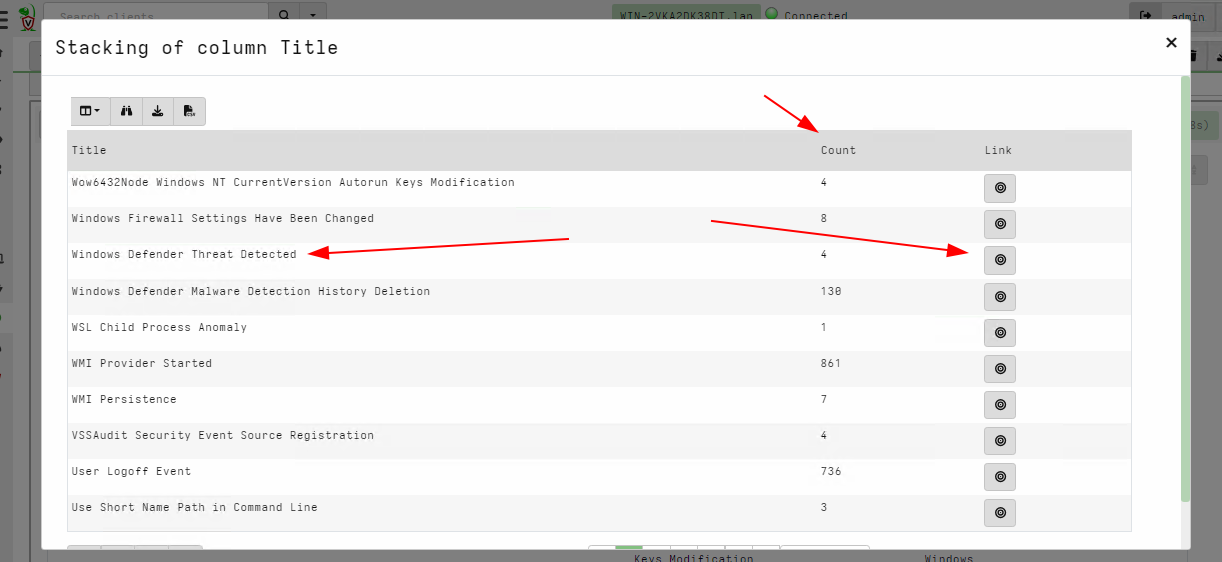
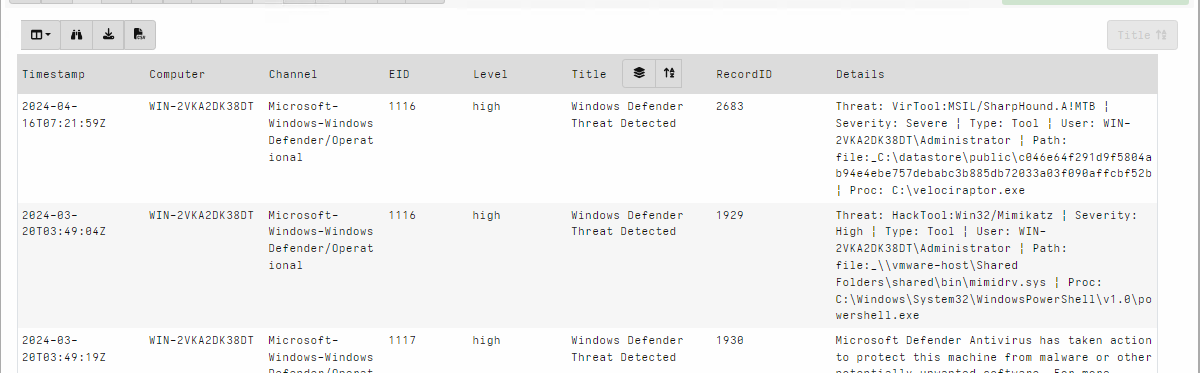
- Clicking on any of the rules navigates the table to the list of rules that actually hit.
Using this technique it is possible to quickly identify the types or categories of activity on the endpoint and see the most suspicious rules. Due to the stacking we dont need to review each individual hit, but only the different types of rules.
For example, say we see a rule description a PsExec lateral
movement, we can quickly identify if PsExec is expected for this
environment, or does it represent a potential threat. If I identify
the rule as important, I can then review each instance to get more
information about what commands were run.
Using the Exchange.Windows.EventLogs.Hayabusa
The Exchange.Windows.EventLogs.Hayabusa artifact is available in the
artifact exchange. This artifact uses an external binary Hayabusa to
evaluate the Sigma rules from the Hayabusa project.
Post processing and analysing the results from this artifact is similar to the procedure described above.
Discussion and limitations
This technique is similar to many SIEMs which forward event logs from the endpoint and apply matching rules. There are some fundamental differences though:
-
SIEMs typically only forward a small subset of logs since the more logs are collected the more data the SIEM backend needs to handle. Typically SIEMs forward logs such as
Sysmon Process Executionbut do not forward other logs for exampleBITS Client Operational Logs. -
SIEM rules are also written to ensure they have a low false positive rate. This means that suspicious activity in one environment which is common in another setting, might not trigger a detection. By stacking on all noisy rules we get to decide for ourselves if a particular rule is acceptable for this environment.
For example an administrator RDP login may be perfectly normal in some environments but a red flag in others! SIEM detections are rarely tuned to the environment.
-
A SIEM may not be present or well tuned, in a particular environment. Running the
Sigmalog triaging workflow can compensate for the lack of a SIEM. -
Data retention is different from a SIEM. Typically SIEMs only maintain logs for limited time (sometimes as low as a month). On the other hand log files are typically rotated based on size. This means that sometimes logs will be present on the endpoint for longer than in the SIEM, while other times the SIEM will contain logs that were already rotate on the endpoint.
-
Because this technique relies on locally stored logs, it is susceptible to logs being cleared by attackers.
Real time monitoring
As an additional step you can enable the Windows.Hayabusa.Monitoring
artifact for real time detection of the same Sigma rules. This can
provide coverage for any future compromises