Troubleshooting Remote Client Issues
The steps in this section assume you are troubleshooting a client that has already enrolled and is actively communicating with the server.
If you are having problems with a client that is:
- not communicating with the server, or
- that has never connected to the server, or
- is failing to start
then please see the section Client communications issues within the Deployment Troubleshooting section.
Debugging a remote client
In the
Deployment troubleshooting section
we explain how to bring up the debug server by providing the --debug flag on
the command line. However clients are often remote and it’s therefore not always
possible to debug the client by starting it with this flag. Often we are also
trying to troubleshoot an issue that happens while collecting an artifact from a
remote client and we want to see what is actually happening in the client
process itself.
We can debug the client while it is running without starting the debug server
using the artifact Generic.Client.Profile. This artifact has access to the
same data exposed through the debug server, but does not require the debug flag
to be enabled in advance.
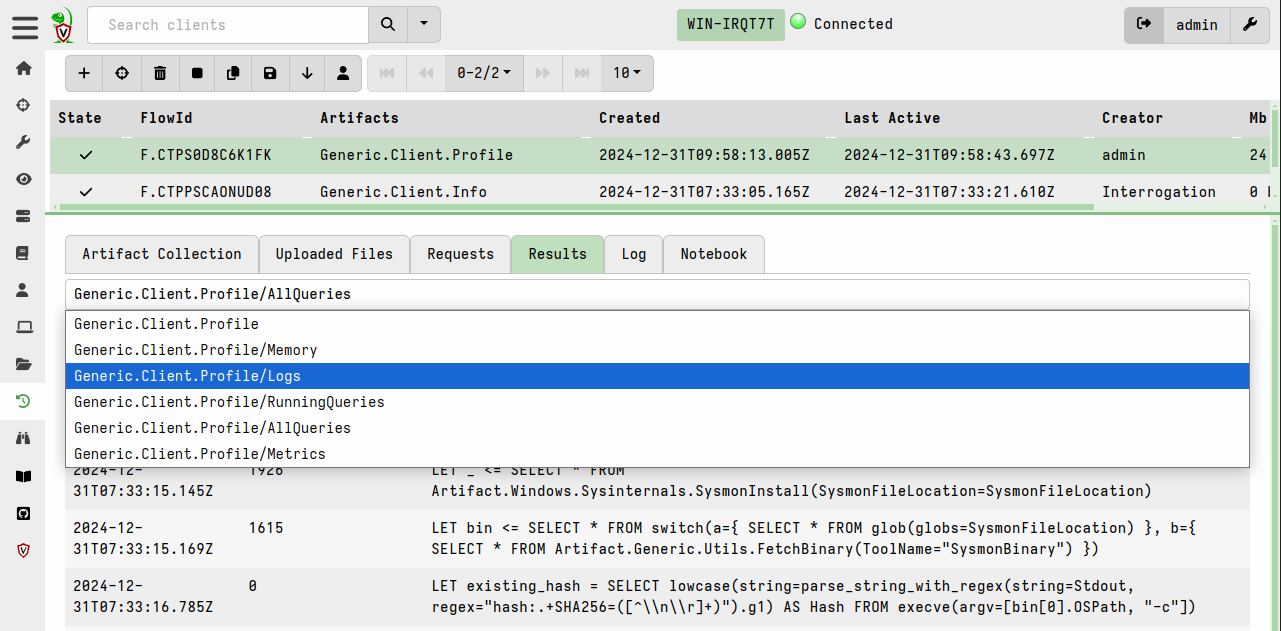
By default the artifact collects the most useful information the developers require, but you can customize the artifact parameters to collect more detailed information if required.
You can share the result of the collection by exporting and sharing it with the development team via Discord or GitHub issues.

Enabling tracing
While collecting the profile at any time is useful, it is sometimes hard to
catch the problem on the client at exactly the right moment. For example, if a
particular query causes a memory leak or severe performance issues it’s possible
that these may occur too quickly, thus preventing the Generic.Client.Profile
artifact from running. Or the client may have already crashed/restarted, or be
too resource-starved to actually collect the artifact.
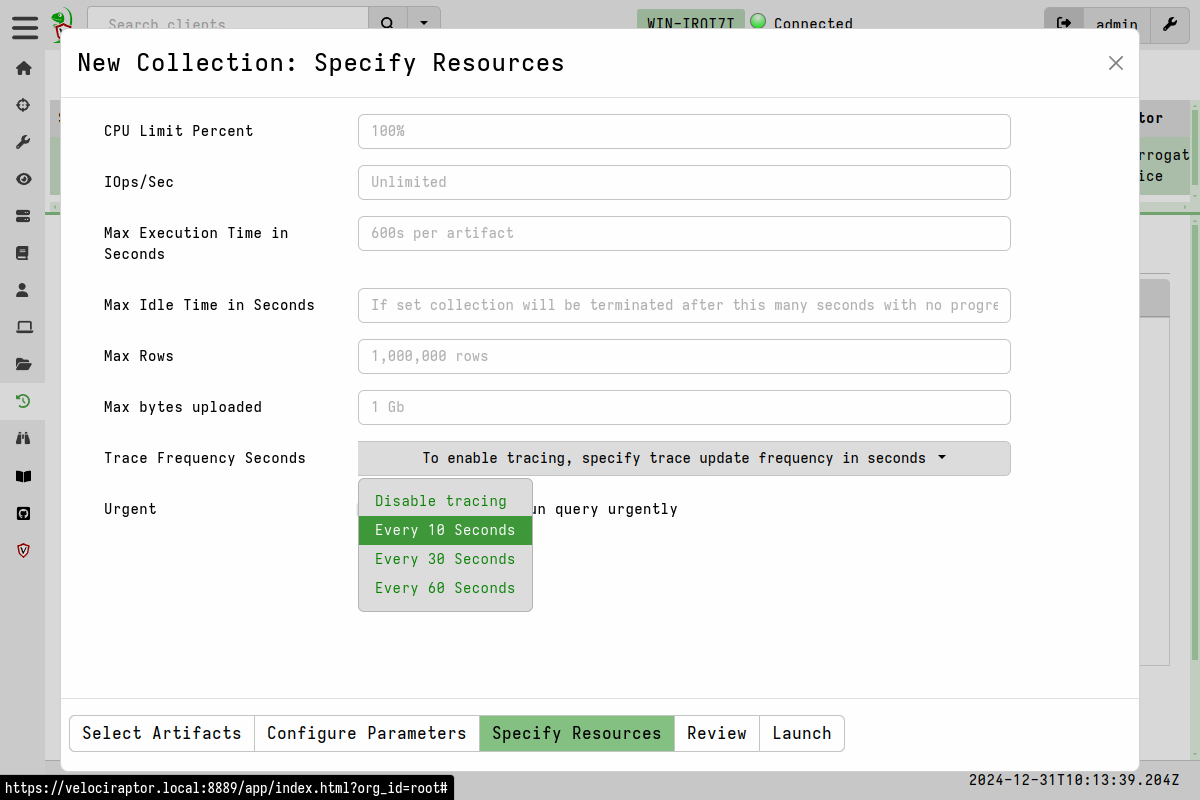
In such situations we recommend enabling tracing during the collection of the suspected problem artifact. This setting will cause the client to take profile snapshots at specified intervals during query execution and automatically include them in the collection results uploaded to the server.
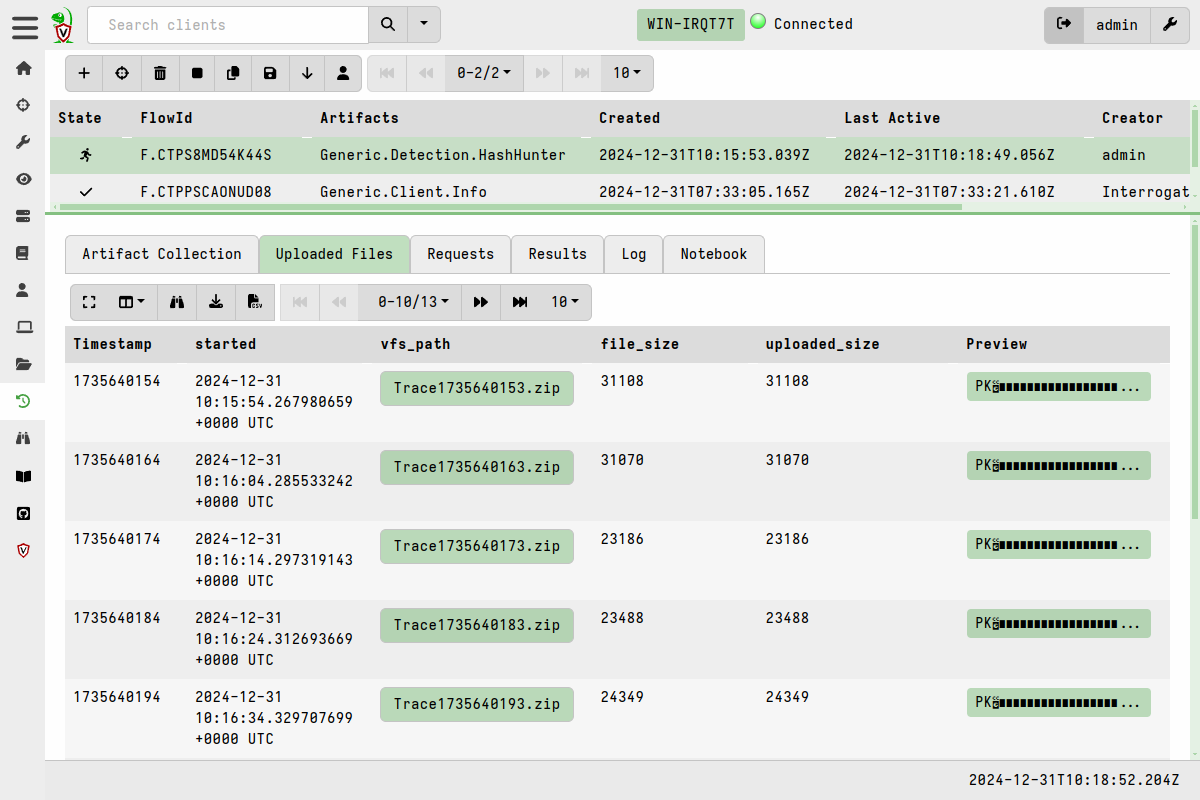
At each interval the client will upload a zip file containing critical profile information during query execution. This information allows us to see the client’s memory and resource footprint as the query progresses, as well as the logs from the client.
Inspecting a remote client’s log
One of the first troubleshooting steps for client-related issues is to run the
client manually from the command line with the -v flag which prints client
logs to the screen. This helps to identify startup issues or transient network
issues. This is often impractical or impossible when the client is remote and we
have means of access to it other than Velociraptor itself.
We could use the Velociraptor client to collect it’s own plaintext logs from disk, however the client, by default, does not write its logs to disk. This is done to prevent information leakage risks - the client’s log may contain sensitive information such as collected artifacts.
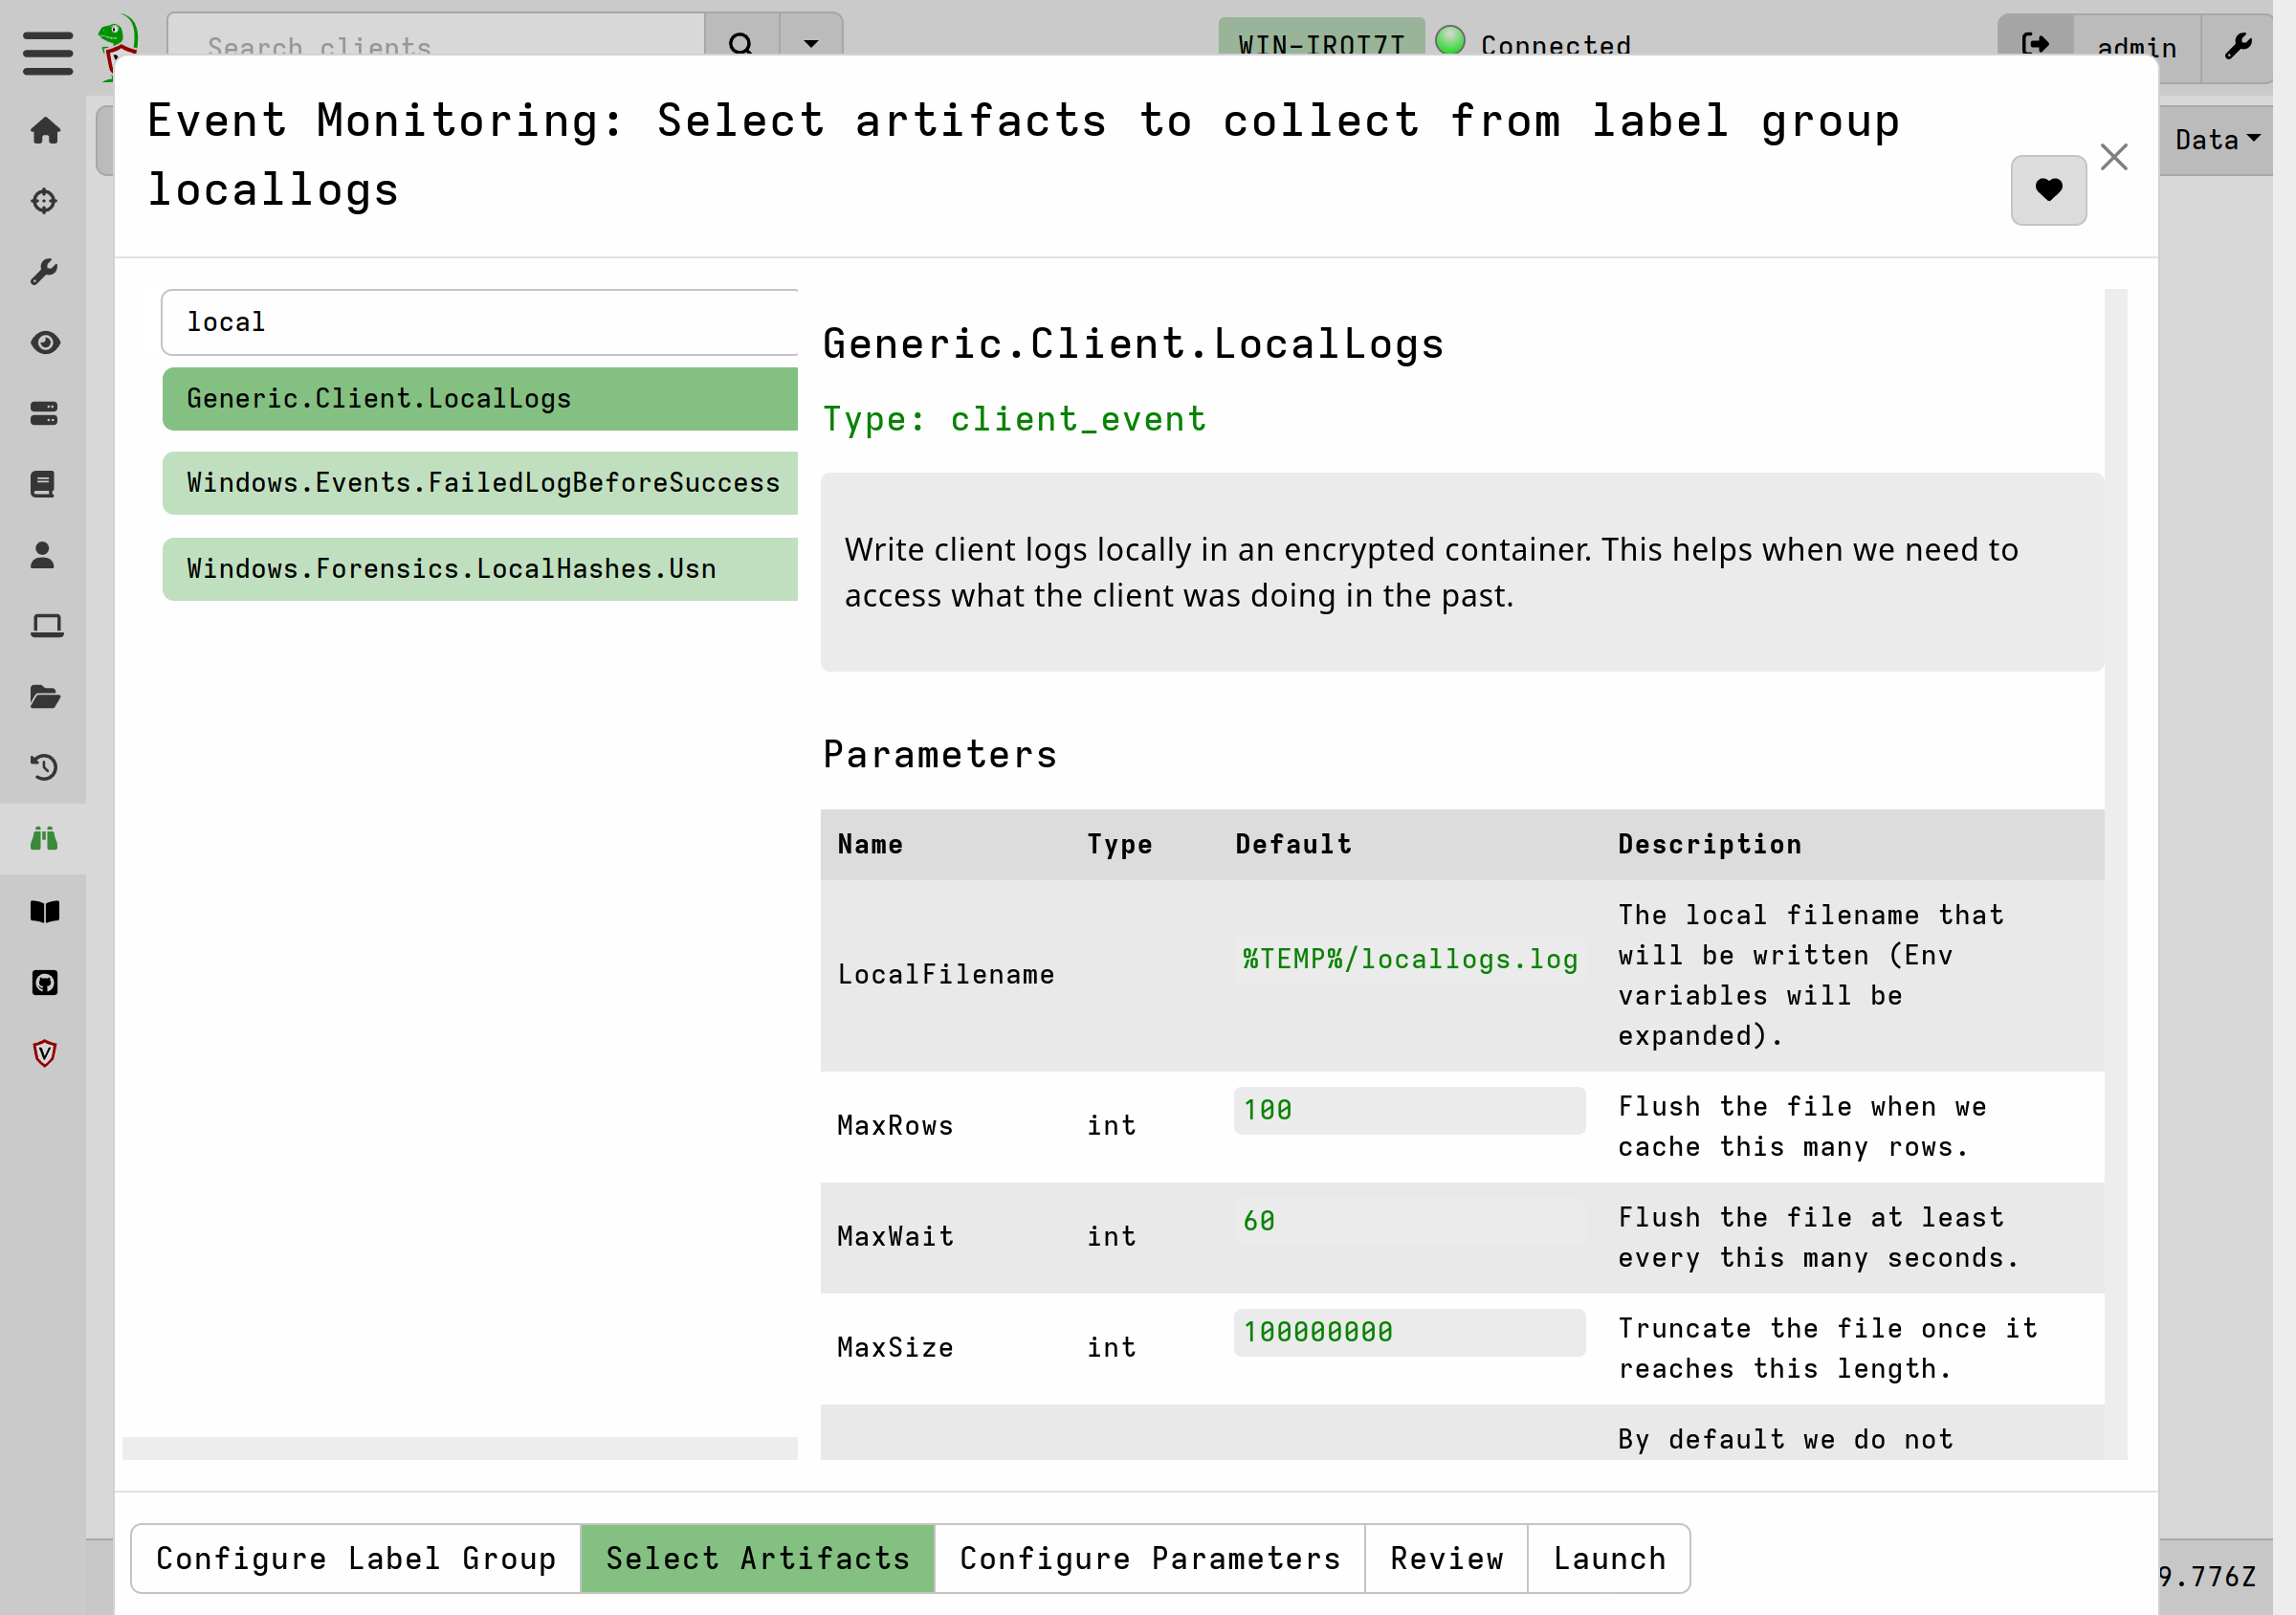
To overcome this, it is possible to tell the client to log to an encrypted local storage file. This allows us to collect the file from the client later and decrypt it on the server while not creating any information leakage risk.
To enable local client logging, you create a new label group
(e.g. logged) and then assign the Generic.Client.LocalLogs client
monitoring artifact to this group. This allows you to begin logging on
any client by labeling it so that it joins the group.
Logs will be written continuously into the specified file on the endpoint. The file is encrypted and can only be decrypted on the server but the client can append logging information, even after a reboot.
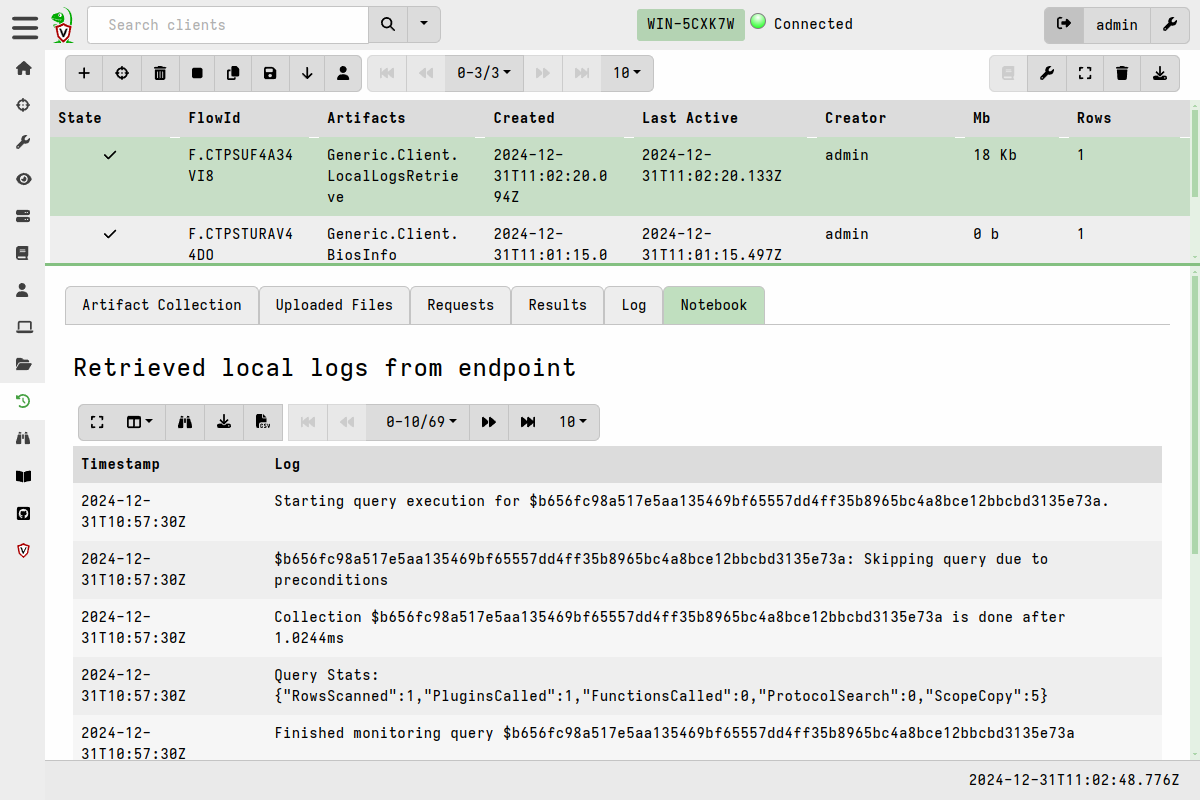
When we want to inspect the log file, we simply collect it from the
endpoint using the Generic.Client.LocalLogsRetrieve artifact.
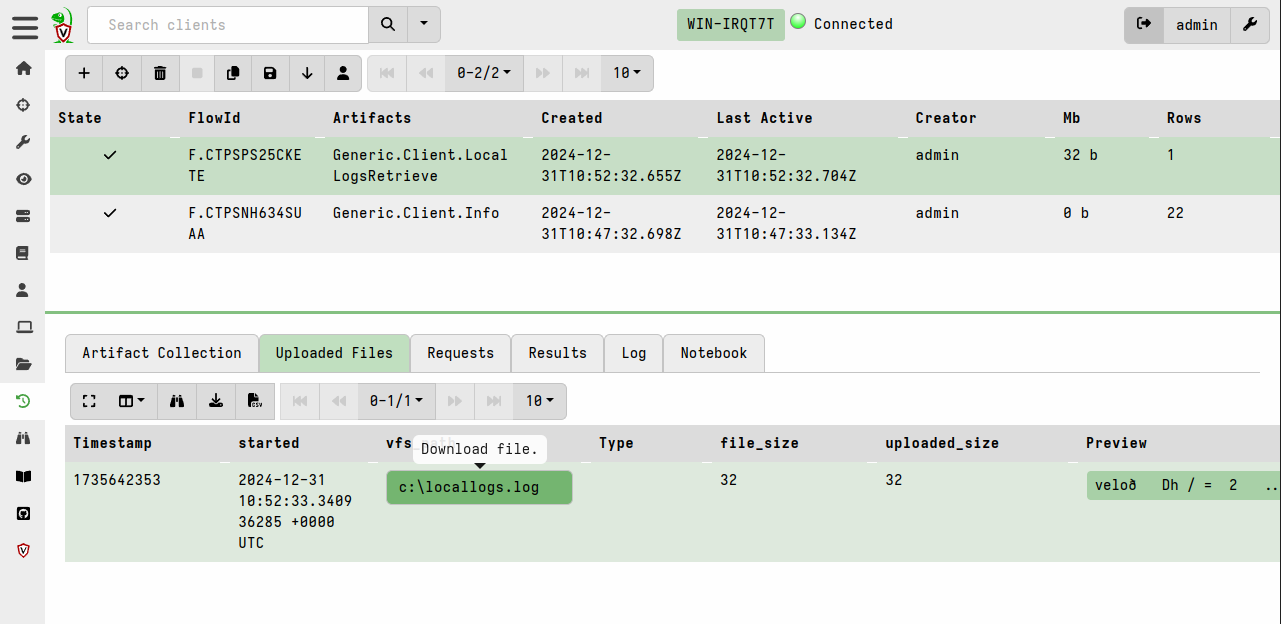
The notebook tab will automatically decrypt the logs and display them in a results table.
Debugging client crashes (Windows only)
On Windows, the client usually runs as a service. If a crash occurs while Velociraptor is running as a Windows service the traceback of the error is printed to Stderr, however these messages are not visible nor stored anywhere. This means that if Velociraptor crashes we cannot see the panic backtrace which is extremely useful for debugging the reason for the crash. In addition the Windows service recovery settings will cause the client to restart automatically after a crash which might make it hard to detect that a crash has occurred.
The Windows binary accepts the setting Client.panic_file in the client config
file. By default this setting is not present but can be added to the config on
selected clients where there is a reproducible issue resulting in the client
crashing. Adding this setting to the config will require local or remote access
to the client’s filesystem.
This setting allows us to specify a path to a log file on the client where
Velociraptor will write Stdout and Stderr in the event of a crash. A value of
$Temp/panic.log will cause the log to be written to the Velociraptor client’s
temp directory which by default should be C:\Program Files\Velociraptor\Tools.
This feature is currently not implemented for non-Windows platforms where this setting will have no effect.
Please submit this file, along with any additional information about what user actions might have caused the crash, to our developer team by opening a new issue on GitHub.