The Admin GUI
The Admin GUI is a web application that can be used to interact and manage Velociraptor. The GUI allows users to schedule new collections, edit existing artifacts or write new ones and launch hunts.
The Welcome screen
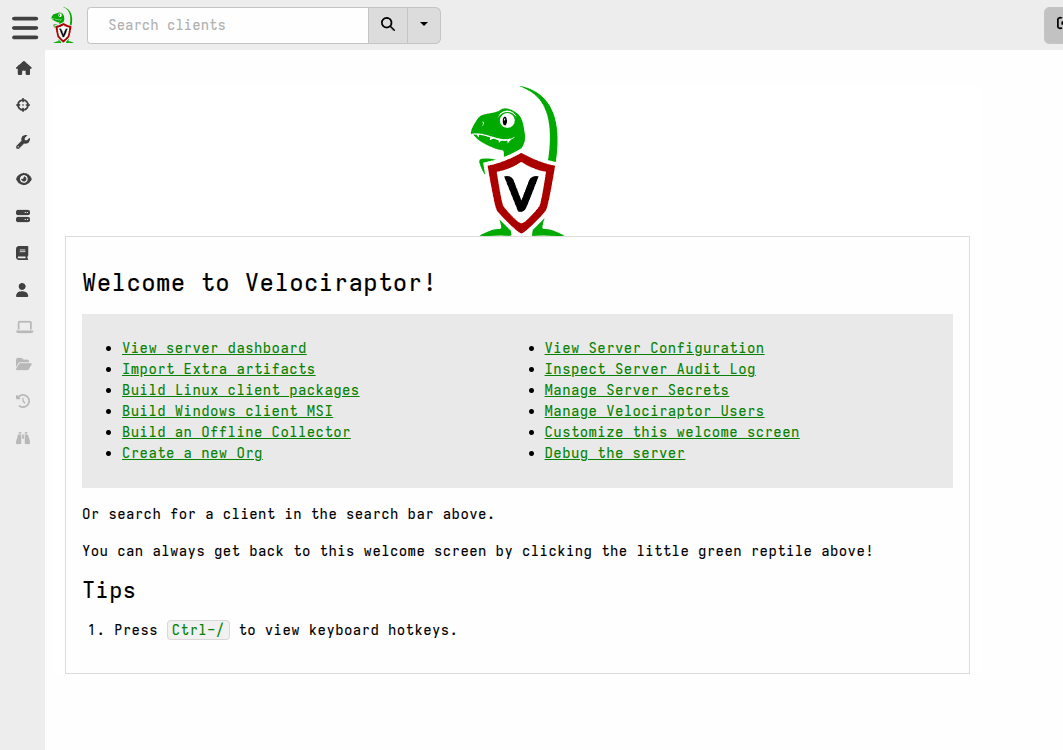
The Velociraptor landing page offers some links to commonly used tasks within the application.
You can
customize the Welcome screen
by editing the Server.Internal.Welcome artifact.
Server Metadata
The link to View Server Configuration takes you to the page where server administrators can edit/view server metadata. This is a collection of key-value pairs that can contain items such as URIs that can be shared by multiple artifacts.
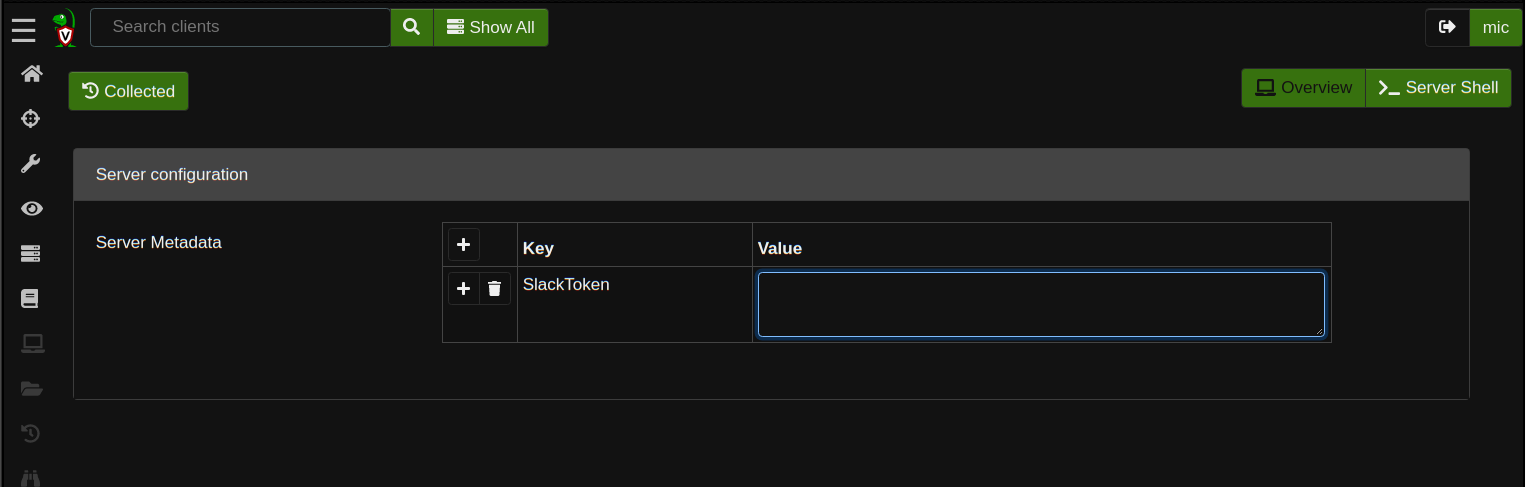
Metadata items can be strings or stringified representations of any other data type. Artifacts can access server metadata using the server_metadata parameter type, and VQL (running on the server, for example in a notebook) can set or retrieve items from server metadata using the server_set_metadata and server_metadata functions, respectively.
Server Secrets
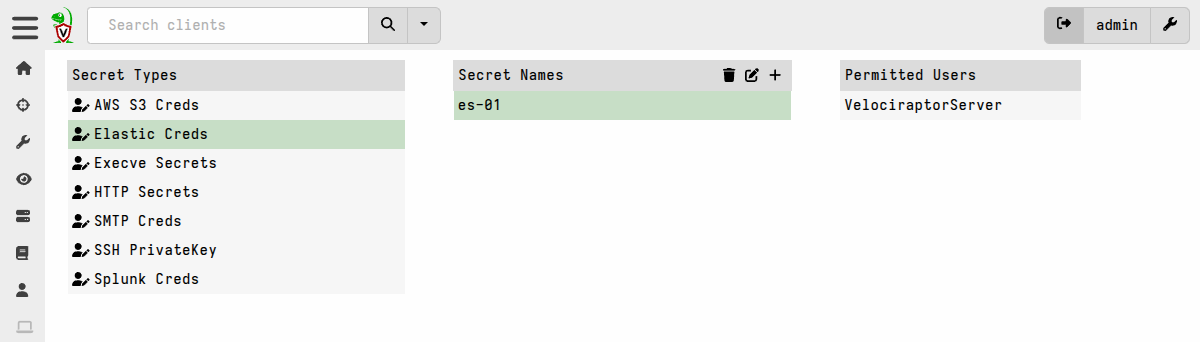
The Manage Server Secrets link will take you to the page where you can define server secrets, which are credentials and other parameters for interacting with external systems that can be securely provided to certain VQL plugins via artifacts. Placing secrets in a centralized location allows artifacts to use them without exposing them to non-administrator users on the server.
User Preferences
The User can customize their interface by clicking on the user tile at the top right of the screen. There are a number of aspects of the GUI application that can be adjusted.

You can read more about the individual options here.
The Server Dashboard
The Server Dashboard can be accessed using the icon on the sidebar. The dashboard shows the current state of the deployment at a high level.
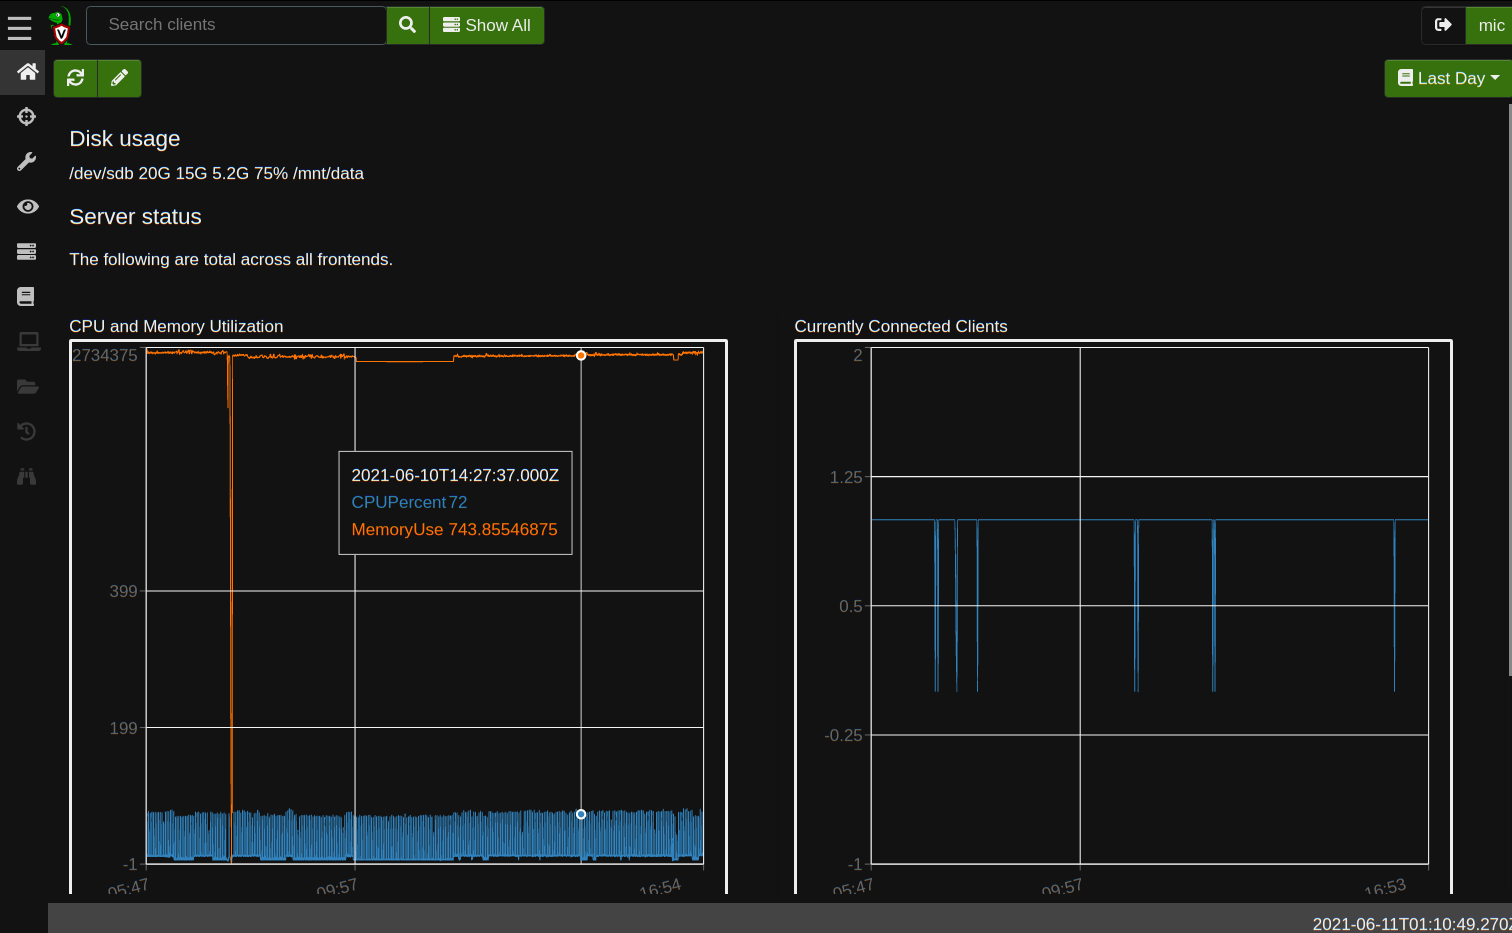
The dashboard shows graphs of total memory and CPU used by all frontends. On the right, the total number of currently connected clients is shown.
By default the view shows data for the past day although you can choose a different time interval from the range-picker on the top-right, or select and drag inside the graph to zoom in on a specific time range.
Below the graphs are tables showing other aspects of the server deployment, for example disk space and users.
All data shown on the dashboard is driven by VQL queries.
The dashboard layout and underlying queries can be
customized
by editing the Server.Monitor.Health artifact.
Working with tables
Since VQL queries are at the core of Velociraptor, and all queries return a list of rows (i.e. a table of data), much of the GUI is dedicated to presenting these results in tabular form.
All Velociraptor tables have a common set of tools available, which are available in a common table toolbar that you’ll see whenever tabular results are presented in the GUI.
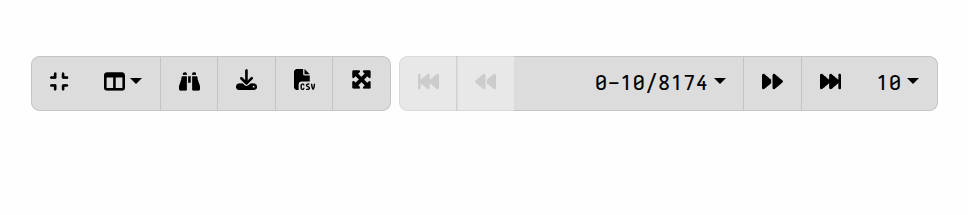
The table toolbar consists of the following buttons:
-
Collapse/Expand All Columns - Sometimes the content of some cells can take up a lot of vertical space. This option toggles between showing the full row heights or shrinking the row display to a standard height.

-
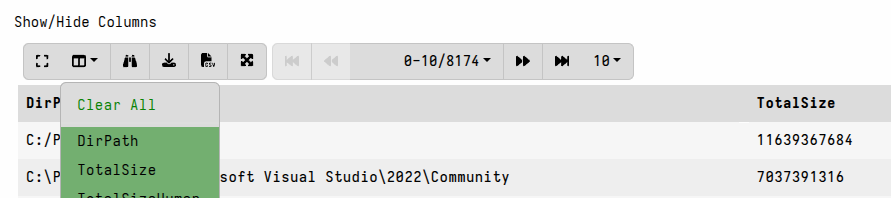
The Column Selector - Allows users to show/hide columns. This is useful when there are many columns and the table takes up a lot of horizontal real estate, or when some columns provide too much data that you don’t want to see.
-
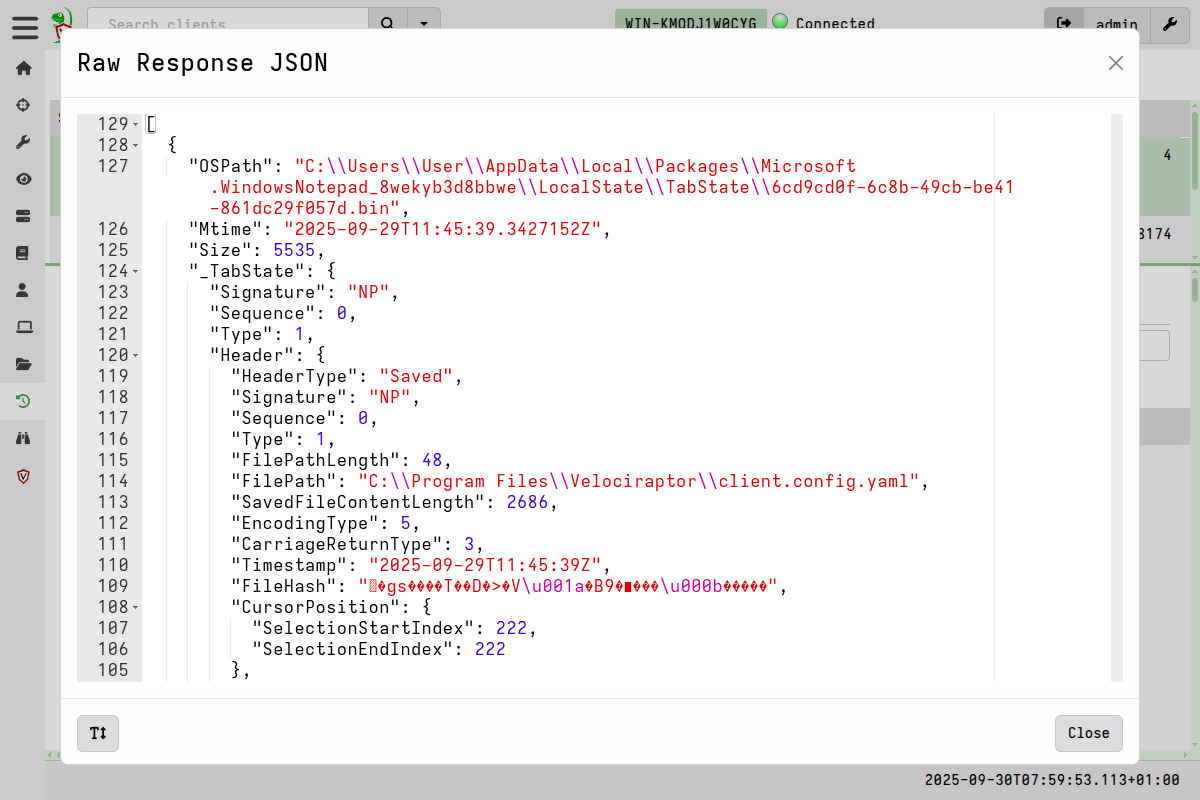
View Raw JSON - All VQL queries simply return a result set encoded as a list of JSON objects. For more complex tables it is sometimes easier to see the precise JSON returned, and clicking on this button displays the raw json in a dialog box.
-
Download table as CSV or JSON - Clicking on these buttons exports the visible table data to a CSV or JSON file. This is usually used to filter out uninteresting columns and produce data files that can be used in other applications, e.g. Excel.
-
Fullscreen - This opens the table in fullscreen view in a new browser tab. This is useful when working with large tables where you need all the screen space you can get.
-
Pagination/Navigation Widget - To the right side is the table navigation widget. This is where you will find all the options to navigate through the table data. You can choose how many rows to display per page and navigate forward/backward, skip to the first, last, or go to a specific page number.