Client Monitoring
We have previously seen the VQL Event Queries are simply VQL queries that never terminate, generating a row for each event that occurs.
We can use this property to monitor for events on the endpoint. In order to build an effective client monitoring framework we need three components:
A number of event plugins that can detect events on the endpoint. For example,
watch_etw()allows Velociraptor to monitor ETW events on Windows,watch_syslog()allows following syslog events on Linux etc.Once events are detected by VQL plugins, we can use the rest of the VQL query to post process these events by applying further filtering or enriching with additional data.
Finally a client monitoring architecture must be used to ensure event queries are always running and forward these events to the server.
In this page we discuss the client monitoring architecture and demonstrate how it can be used to feed events from the endpoint to the server.
VQL event plugins generally start with the word “watch” to indicate
they are event plugins (e.g. watch_etw, watch_evtx, watch_usn
etc). Sometimes there will be a related non-event plugin for example
parse_evtx() simply parses the event log file beginning to end,
while watch_etvx() watches the file for new events and does not
terminate.
You can search for all plugins on the VQL Reference page, so simply read about all available event queries here.
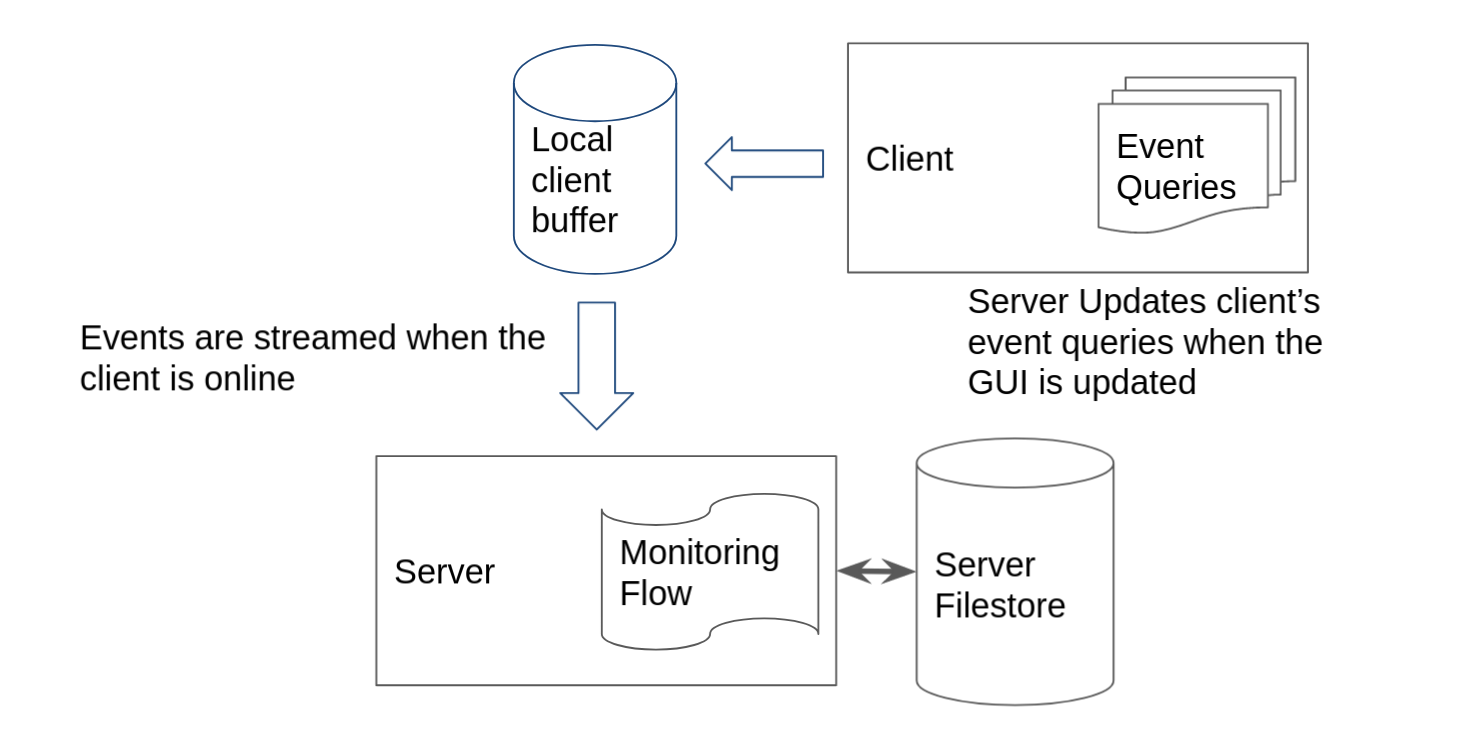
Client monitoring architecture
The client maintains a set of VQL Event Queries that are all run in
parallel. This is called the Client's Event Table and it gets synced
from the server when needed. The client writes these Event Queries in
the writeback file so they become available as soon as the client
starts - even when not online!
If the client is offline, these will be queued in the client’s local file buffer, until the client reconnects again, at which time they are synced back to the server. This architecture ensures that clients can not lose events, event when not online. It also means that clients are able to monitor for events autonomously - the server is only needed to refresh the client’s event tables.
When any of these produce rows, the client streams the events to the server which in turn, writes them to the filestore.
Installing client event queries.
Each client has a set of event queries that it is constantly running
called an Event Table. The server can update the client’s event
tables based on client labels:
Event Artifacts within label group “All” apply to all clients regardless of label or OS type (Note that artifact preconditions are still honored).
Event Artifacts can target specific label groups. If the client has that label applied, the event table for that client will include these event artifacts as well.
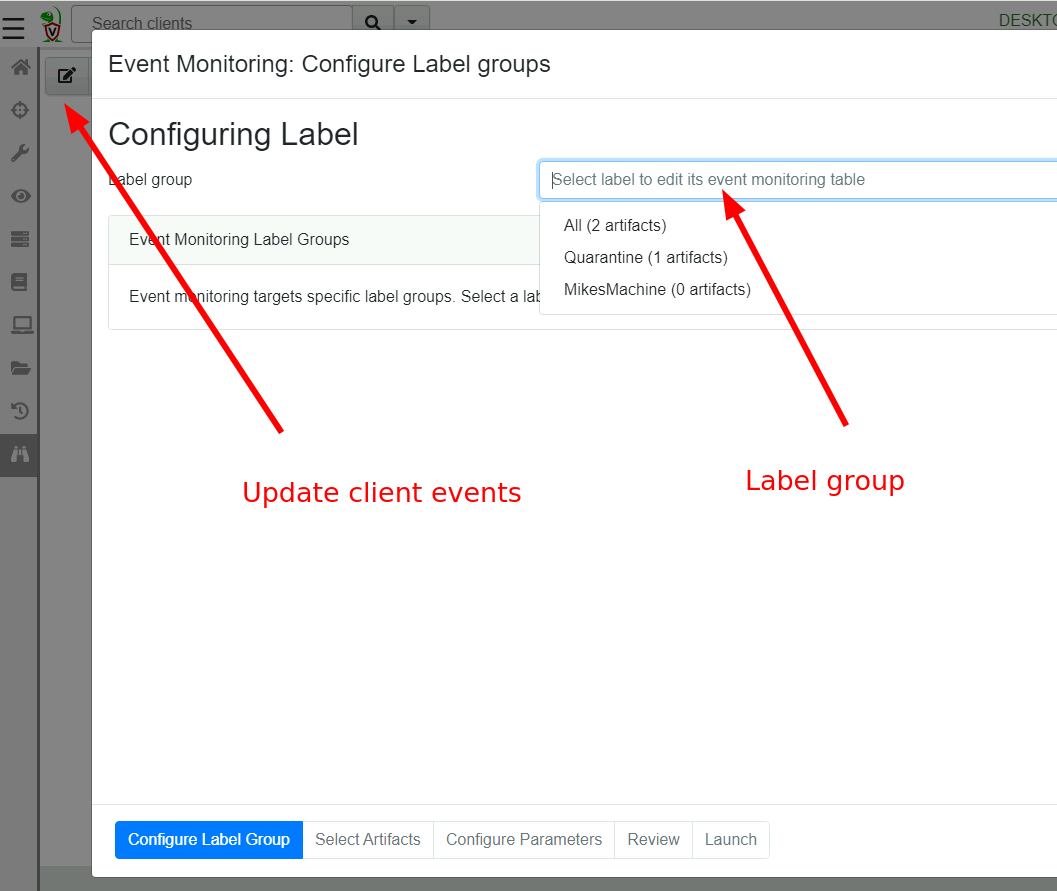
Note that label group membership is dynamic - clients may be added or removed from label groups at any time by simple applying or remove the relevant label. Applying a label to a client automatically updates the client event monitoring queries as well.
In this way it is possible to move clients into label groups that require different monitoring queries - for example perhaps you wish to monitor only some of your end points for powershell or psexec executions some of the time, simply apply the relevant label.
Selecting event artifacts to apply
Velociraptor uses an “Artifact” to package VQL queries in a structured
YAML file. Event queries are no different - they are contained within
Event Artifacts. In the next step we can select which artifacts will
be applied to this label group.
For this example, we select the Windows.ETW.DNS artifact to collect
DNS lookup from clients.
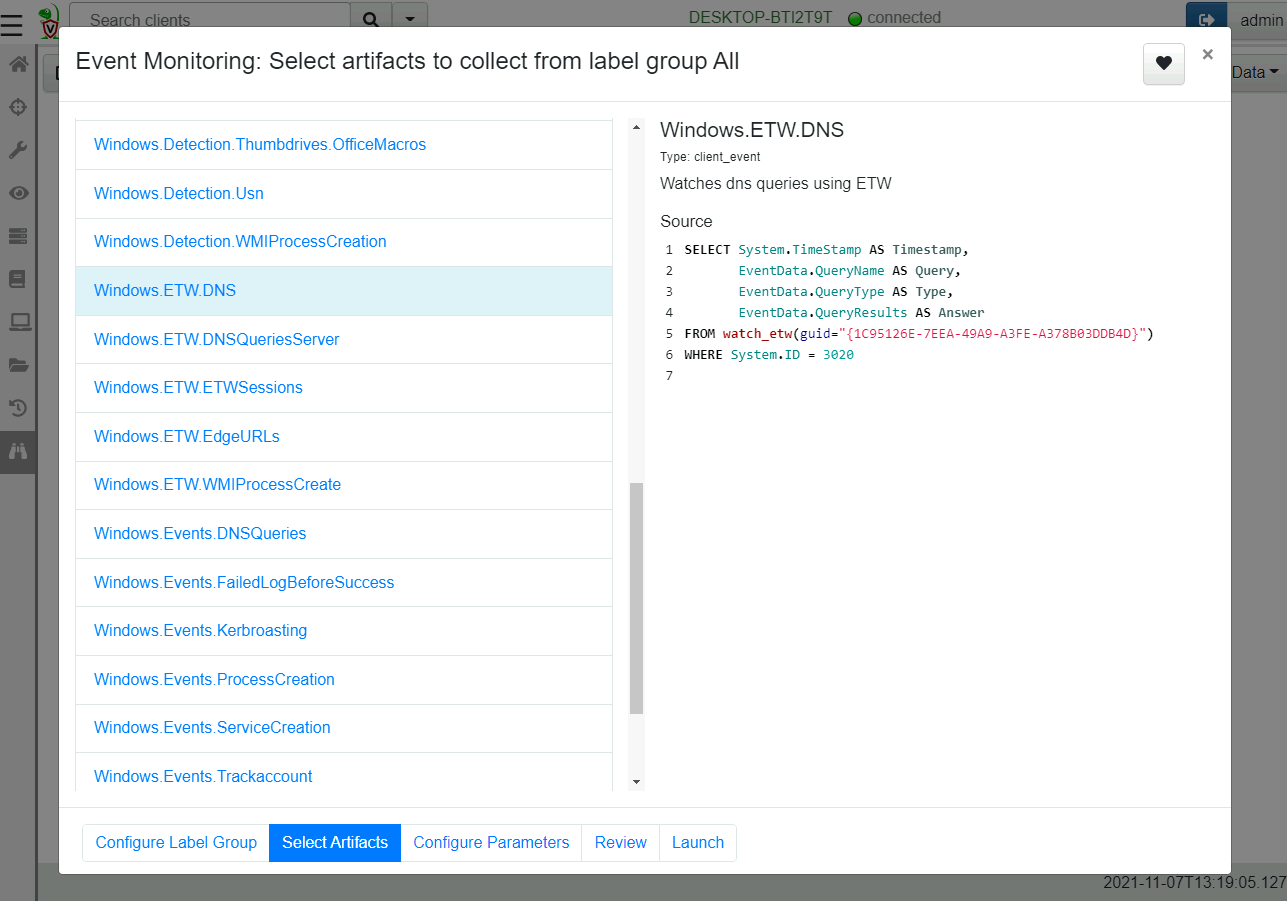
While the artifact selection UI might look very similar to the new collection UI or new hunt UI, the main difference is that the artifact selection UI in the Event selection workflow only shows event artifacts.
Event artifacts are identified by their type: CLIENT_EVENT entry in
the definition YAML.
If you add a new event artifact, be sure to designate it as a CLIENT_EVENT type or else it will not appear in the UI and the user can not select it.
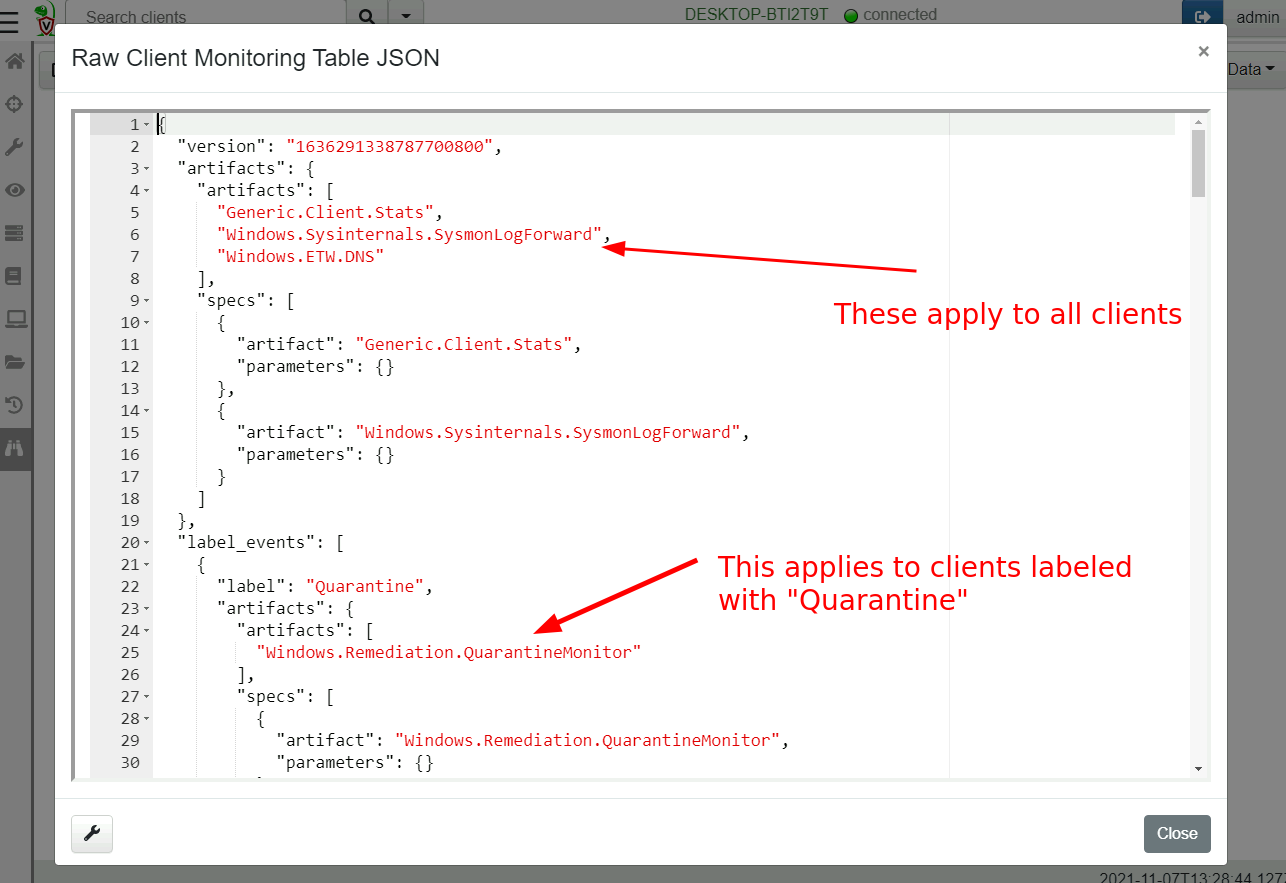
Inspecting the current monitoring table
The current configuration can be viewed by simply clicking the “Show client monitoring table” button.
Viewing collected events.
Once the client syncs its client monitoring table, it will start forwarding events to the server. Events are simply rows returned by the VQL query. The server simply stores these rows in the filestore and provides a timeline based UI to inspect the data.
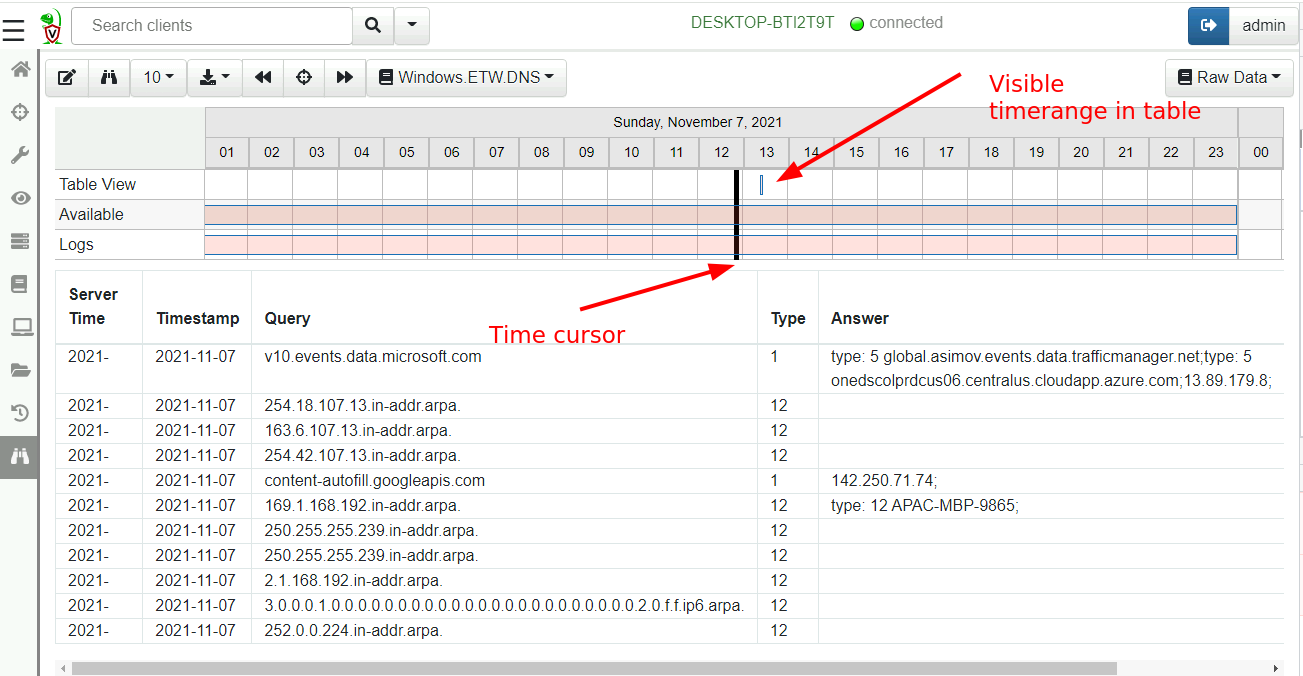
The view is split into two halves. The top half is the timeline view while the bottom half is the table view. The events can be viewed in the table, while the timeline view provides a quick way to navigate different time ranges.
You can see the timeline view is split into three rows:
Table Viewvisualizes the time range visible in the table currently.Availableshows the days which have any events in them.Logsvisualizes the days that have any logs in them (You can view query logs by selecting theLogspull down on the top right).
In order to keep the table brief the timestamps are abbreviated - you can hover the mouse over those to get the full timestamp. Usually the exact timestamp in the table is not important as we can see a visualization of the time range in the timeline above.
You can zoom in and out of the visible time ranges using Ctrl-Mouse Wheel or by clicking the timeline itself.
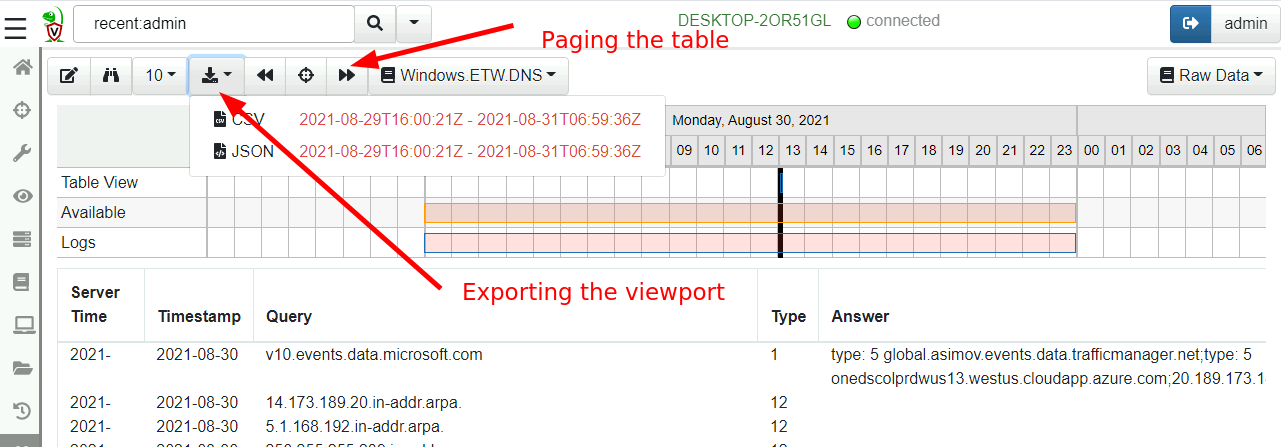
By clicking the tool bar it is possible to page through the table to
view visible events. If you need to export the data, simply click the
Export button and select either JSON or CSV format. The export
functionality applies to the visible time range so you can finely tune
which events should be exported (simply zoom the visible range in or
out).
Although VQL queries emit rows in real time, Velociraptor does not forward the event row immediately to the server. This is done to avoid too-frequent communications with the server. Instead, the client will batch rows in memory (by default for 120 seconds) and send them in a single POST upload. This means that it could take up to 2 minutes for events to appear at the server once a new client event table is installed.
Further processing client monitoring events.
Client event queries simply run on the endpoint and forward rows to the server. The event queries generally fall into two types:
Collecting real time data such as ETW logs, process executions logs, Sysmon logs etc. These are typically collected by Velociraptor and sent directory to an external system (e.g. Elastic or Splunk). Typically the VQL for such queries contains minimal filtering and simply forwards all events to the server.
Selective and targeted queries. These artifacts contain refined detection and enrichment log within the VQL query itself such that only high value events are actually forwarded. These more targeted queries send few rows but when an event is detected, it probably should be escalated.
In either case, Velociraptor itself does not do anything with the events collected by default, other than write them to storage. Further server side processing is needed using server side event queries.