Timelines in Velociraptor
New feature
This feature is available in the 0.73 release. You can Download it and provide valuable feedback.
Digital forensics is about reconstructing what happened in the past based on available artifacts. When applying Digital Forensics to an incident response case, we try to follow the movements of the adversary through the network and answer some common questions:
- What happened?
- When did it happen?
- What potential information was compromised?
- How can we harden the system to prevent this from happening again.
A very useful tool for every incident manager is to build a timeline of relevant information. A timeline helps to communicate the sequence of actions the adversary took. Additionally timelines help us to identify the time period of interest to the specific case, so that we can ignore other data that happened either before or after the incident. In this way timelining is a useful triaging tool.
An example timeline in an investigation.
Timelining an incident is an important part of many investigations. Before I describe the timeline feature within Velociraptor, it is important to understand how timelines are used traditionally. After all, Velociraptor is simply a tool that makes the workflow simpler, but ultimately the same general process is followed!
The simplest approach is to manually keep a spreadsheet of events and timestamps, sorted by time. This approach does not require any additional tools than a simple spreadsheet:
-
Analysis step: The investigator identifies important events to annotate by analyzing various forensic artifacts or even just interviewing people, looking at other sources of evidence like security video etc.The purpose of this step is to identify and isolate noteworthy events from the thousands of time relevant data typically encountered in an investigation.
-
Annotation step: The investigator then simply writes a timestamp in one column, a message in the other column and any additional information in a third column.The purpose of this step is to assign semantic interpretation of noteworthy events to explain how they are relevant to the case.
An example of such a manual approach is
| Timestamp | Message | Information |
|---|---|---|
| 2021-10-12 10:10Z | Suspect entered vehicle | source=Video surveillance, Vehicle_tag=XYZ, Suspect=Bob |
| 2021-10-12 11:05Z | Call Received | source=Call Log, Number=555-1234, Duration: 2min |
| 2021-10-12 11:06Z | Vehicle crashed | source=Police Report, Place=I95 South, near exit 175 |
The above example is a typical investigation timeline:
-
The timeline contains information from multiple sources. We call each entry in the table an
event. -
Each source contains different types of information, but each event has some common fields:
Timestamp: This is when the event occurred (usually specified in a common timezone).Message: A generic human readable message to explain what this event represents.Information: This column contains any event specific information. Since this information can vary, the data is normally stored in the same column in some kind of structured way (e.g. a Key/Value format)
The above timeline helps us to explain what happened - we only see relevant, annotated events (and a note relating these to the case). This timeline adds support to the central theory of what actually caused the accident - likely mobile phone use by the driver.
The important takeaways from this example are:
- I combine events from different sources based on their timestamp.
- Only important events to the case are annotated with a human readable note that relates them to the case.
- The timeline helps support a certain theory or conclusion of what actually happened.
Case study: Ransomware intrusion
To illustrate how a timeline can be used in a typical DFIR investigation, let’s consider a simple (if contrived) case study: Ransomware deployment on an endpoint.
Step 1: Create a global notebook
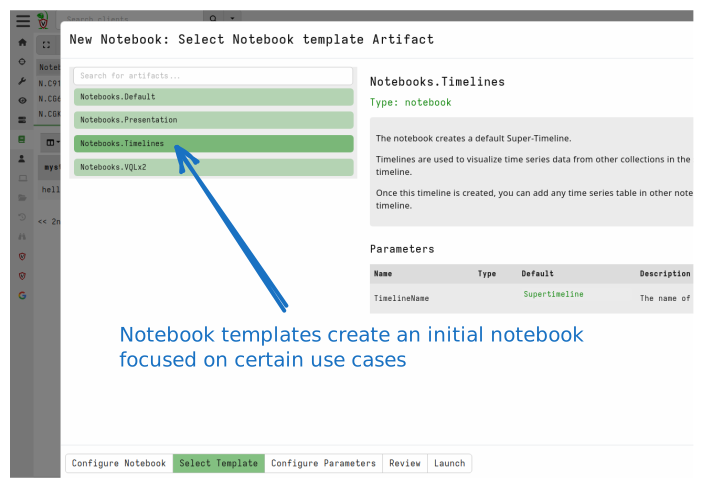
Velociraptor notebooks are interactive documents that can be shared between a group of investigators. Each notebook consists of cells, while cells can contain markdown text or VQL queries to evaluate.
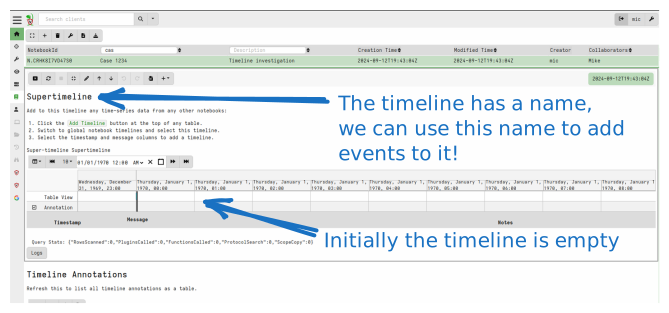
I will start off by create a global notebook to hold the timeline.
Step 2: Collect some artifacts!
In this case I will directly collect artifacts from the endpoint in question. I search for the hostname and select it for interactive triage.
Usually at the start of an incident I don’t really know what happened
or where to start. I like to start of with some Sigma rules as curated
by the Windows.Hayabusa.Rules artifact. This artifact is maintained
by the separate Velociraptor Curated
Sigma site. The artifact combines many
rules from the
Hayabusa and
Sigma projects.
Sigma rules are a good place to start as they can indicate any suspicious activity on an endpoint. Normally Sigma rules must balance false positives with the probability of missing a detection. However, in the triage context, I really want to see all rules - including ones that are noisy and produce a lot of false positives.
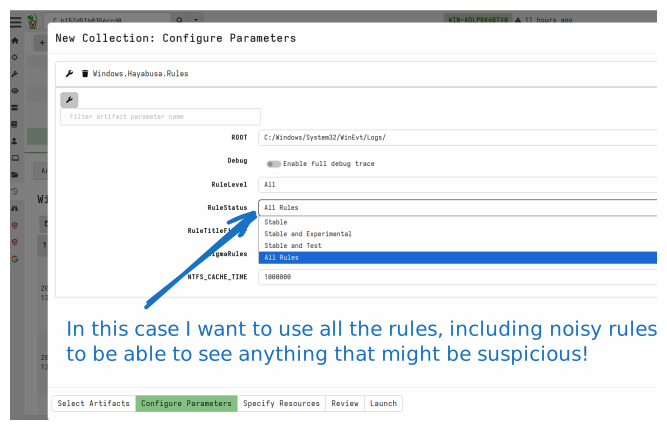
Therefore in this case I will choose to evaluate All the rules on the endpoint. The artifact will then evaluate all rules against each local event log file.
This results in over 18,000 events - too many to manually review! I
will post process this collection by selecting the collection’s
Notebook tab. This is a notebook that is created inside each
collection for post processing just that one collection results.
In this case I don’t really want to review every single hit. I just want to see what kind of rules matched to get an overview of what happened. I can then drill down into each hit to identify the important ones.
This type of processing is called Stacking. Velociraptor has an
inbuilt stacking feature within the GUI - it is available on any
table!
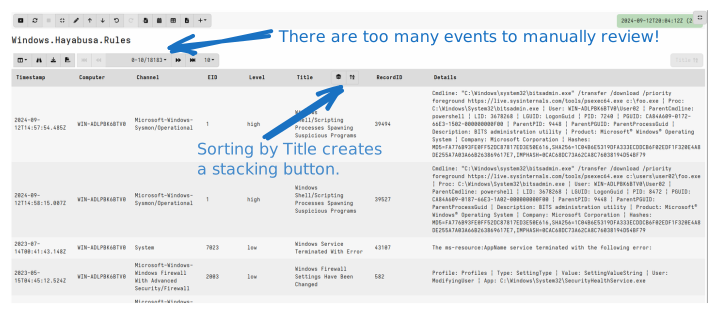
First I sort by one of the table columns - This will select the column I want to stack on. In this case, I will sort by the Rule Title. Once the table is sorted, the GUI shows the stacking button. Clicking the stacking button shows the stacking overview for this table.
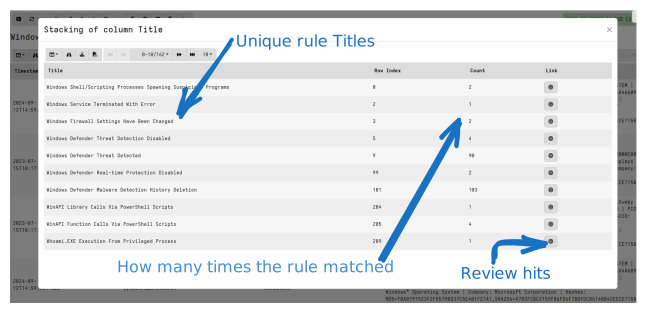
Stacking is a common technique to view aggregation of data quickly. I allows us to see what kind of rules matches in this case, and how many times they matched. We can then drill down on each of these matches to see if they are relevant to the case.
In the above, I immediately see some interesting rules matched! Lets
consider the rule Windows Defender Real-time Protection Disabled. This event matched twice in the logs but it is usually a
strong signal so I want to drill down on it.
If I click the Link icon in the stacking table, I will be able to explore the specific times this rule matched.
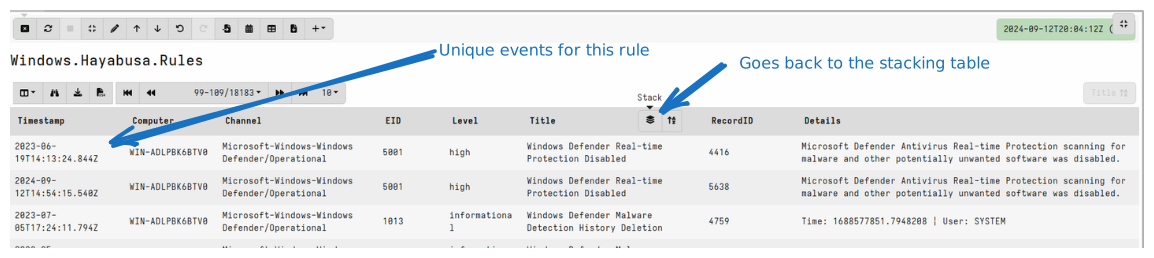
I see a match in 2023 and one in 2024. In practice a lot of false positives will occur, or even evidence of previous compromise unrelated to the current incident! Reviewing these events at this stage can help to put a timeline on the incident.
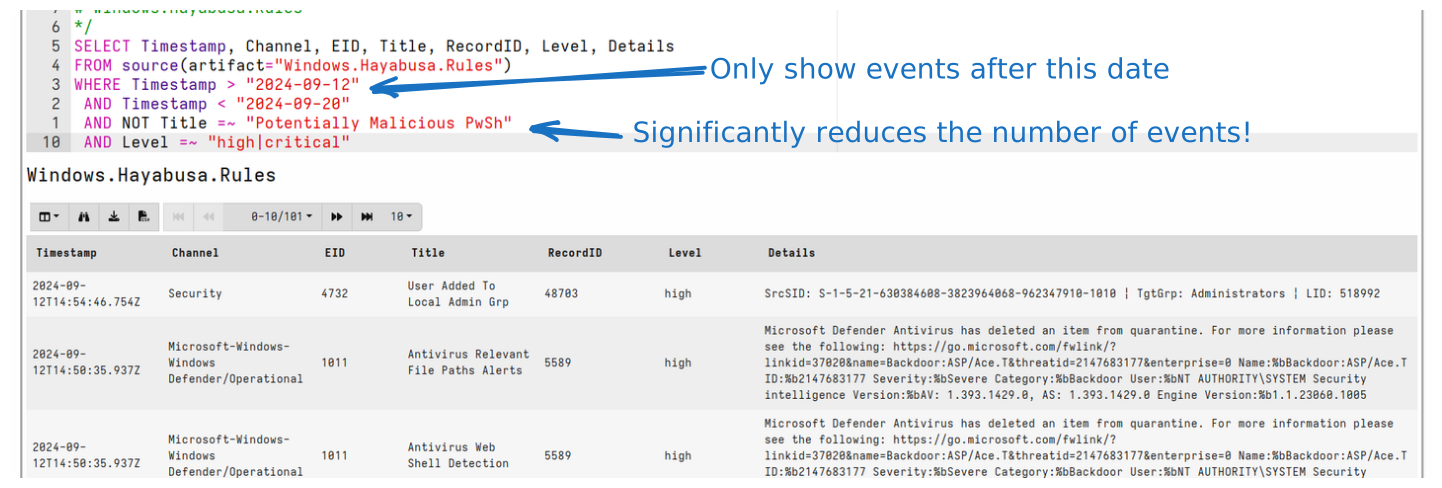
For our purposes we can narrow the time of interest to shortly before
2024-09-12 and this helps us quickly focus on events after that time
(in a real case, I will be more exhaustive in checking for possible
earliest compromise)
I will then reduce the table to all events after 2024-09-12 by
adapting the cell’s VQL query. In the initial stage I will only look
at high and critical level events, and remove rules which usually
produce too many false positives.
This reduces the number of events to consider from over 18,000 to about 100 high confidence events that I can manually review.
Adding to the timeline.
Velociraptor’s timelines implementation streamlines and enables the above described manual process. We still mostly follow the same general pattern but within the GUI much of the maintenance of timelines is made easier and reduces friction for the user.
First let’s define some terms:
-
An
Eventrepresents something that happened at a point in time. All events contain the following fields:- A Timestamp is the time when the event occurred.
- A Message is used to describe what the event is.
- A Data field contains arbitrary data as key/value pairs - depending on where the event is coming from, this data will vary.
-
A
Timelineis a series ofEventswith a name. -
A
Supertimelineis a collection ofTimelineswhich allows us to interactively inspect all the timelines together. The GUI overlays all the events together into one UI and allows the user to enable or disable any specific timeline in order to focus on specific types of information. -
An
Annotationis a specialTimelinewithin theSupertimelinethat users can add specific messages to. The annotations can be hidden or shown as other timelines but the GUI provides a way to add/remove annotations by inspecting other events in other timelines.
The ultimate goal of the Supertimeline is to build a useful set of
Annotations from all the events in the different timelines so that a
report may be written from it. The annotations timeline is what we
refer to as the “investigative timeline” (Similar to the example
above).
Because the Annotations timeline is for user consumption, we only want high value and high confidence events and not too many of them. We don’t expect hundreds or thousands of annotations! Ideally we can export the annotations from a timeline analysis and present it as a running commentary of what happened.
Let’s add our Sigma analysis to the timeline. Within the Reduced Sigma
table, click Add to Timeline.
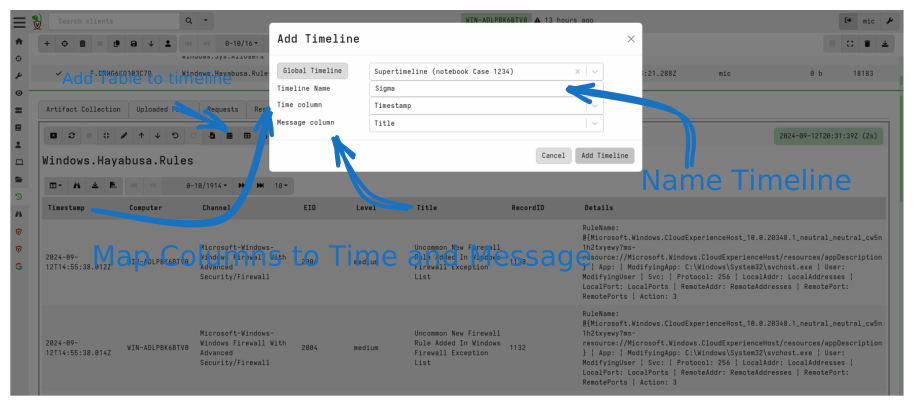
The Add Timeline dialog allows us to create a timeline, add it to a
supertimeline and configure how events are created from the current
table:
-
Selecting
Local TimelineorGlobal Timelineallows me to select whichSupertimelineI want to add this to. Global Timelines exist within theGlobal Notebooks(i.e. those created from a template and are visible from the notebook side bar).I will select the
Supertimelinein the notebook I created earlier. -
Next I will name the new
Timelineto remind me where these events come from. This name will be used to remind me where the events I see come from. I will call thisSigmaas this is the result of matching the sigma rules. -
Before the events can be created I need to designate which is the Timestamp and Message column - Each event must have a
Timestampand aMessagefield, while the data field will consist of the rest of the event specific data.
The timeline viewer
After the reduced Sigma timeline is added, I can see the timeline notebook updated.
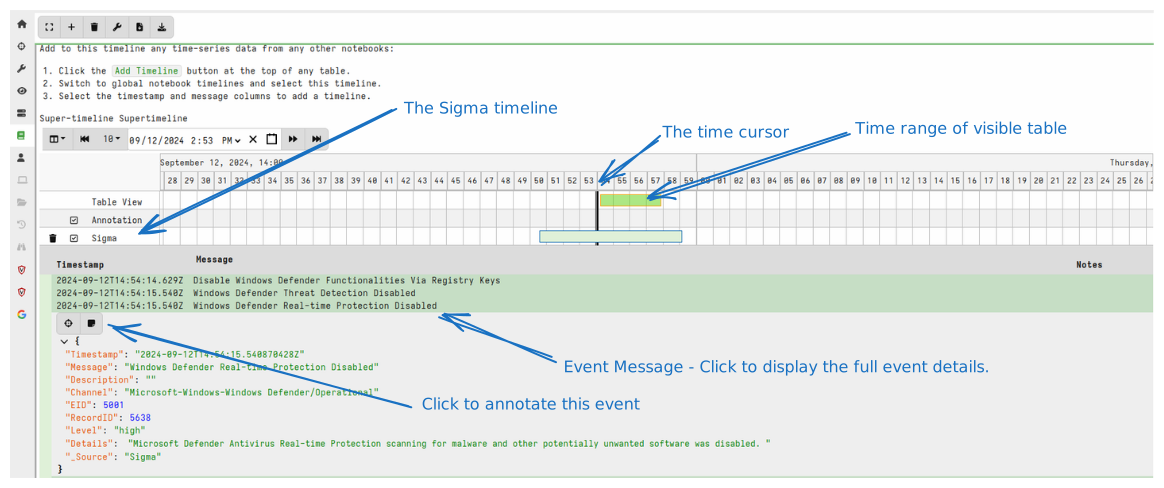
Following is a description of the UI:
- The display is divided into a
Timeline Visualizerat the top and aTime tableat the bottom. - The
Timeline Visualizeritself is divided into:- The
time navigatorat the top showing event times in UTC. You can drag and zoom to change the time scales, or click on the column headers to change the time resolution and zoom in and out of the time ranges. - Below the
time navigatoris theTime Group Visualizer. This shows the range of each time series as a color block. This color is also matched with the individual events shown in the timeline below. - Each time group represents a distinct time series which can be enabled or disabled. Disabling a time series hides it from the time table below, making it easier to examine only events from the enabled time series.
- The
Time Cursorcan be moved by clicking within thetime navigator. This controls which events are shown in theTime Tablebelow.
- The
- The
Time Tableshows events from all enabled time series that occur after theTime Cursor.- Each event shows the
Timestamp,MessageandNotescolumns as an overview row. - Clicking on the event overview shows all fields in the event.
- Once the event is expanded, the event toolbar allows the user to annotate the event.
- Each event shows the
Annotating an Event
When an event seems important, it can be annotated. Annotating an
event will copy it into a special time series within the
Supertimeline called Annotation.
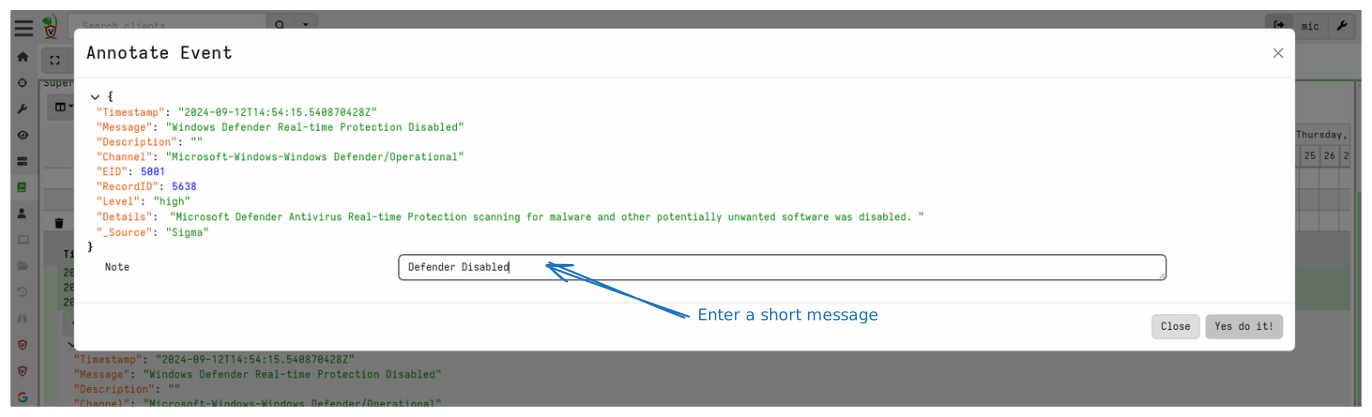
The annotation should contain an explanation as to why this event is relevant to the case.
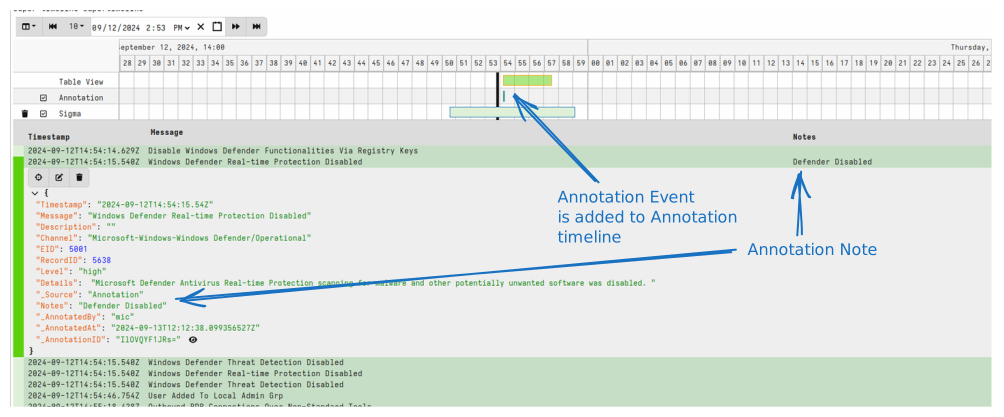
The annotated event is added to a separate timeline, which may be enabled or disabled similarly as the other time series. This allows us to concentrate on the annotations separately from other time series.
Adding further time series
As I collect other artifacts, I can get more information about the case:
-
Collecting the
Windows.Sys.Usersartifact enumerates the local users on the system, and estimates the time that the user last logged into the system by reporting the Modified time on the User’s profile registry keys and home directory modification time.I reduce the data to show the Home directory modification time (Last time the user logged into the account).
SELECT HomedirMtime, Name, Description, Data
FROM source(artifact="Windows.Sys.Users")
I will use the HomedirMtime as the Timestamp column when adding
this time series.
-
Collecting the
Windows.Forensics.Usnartifact can reveal information about files created on the filesystem and their creation timestamp. This gives us an idea of what files were introduced into the system by the attackers.I reduce the data to show only created files in the time range of interest which have a full reconstructed path.
SELECT Timestamp, OSPath, Reason
FROM source(artifact="Windows.Forensics.Usn")
WHERE Timestamp > "2024-09-12"
  AND NOT OSPath =~ "Err"
AND Reason =~ "CREATE"-
Collecting the
Windows.Timeline.Prefetchartifact reveals information about when executable files were run.I reduce the data to show any execution after the time of interest.
SELECT event_time, message, source
FROM source(artifact="Windows.Timeline.Prefetch")
WHERE event_time > "2024-09-12"-
Collecting the
Windows.System.TaskSchedulercan reveal information about new scheduled tasks added to the system. Scheduled tasks are a common reinfection mechanism added by attackers. Scheduled tasks are defined in XML files in theC:/Windows/System32/Tasks/directory. We can use the modification time for these files to determine when they were last created or updated.I reduce the data to show any scheduled tasks with the modification times as the timeline’s timestamp
SELECT Mtime, OSPath, Command
FROM source(artifact="Windows.System.TaskScheduler/Analysis")
WHERE Mtime > "2024-09-12"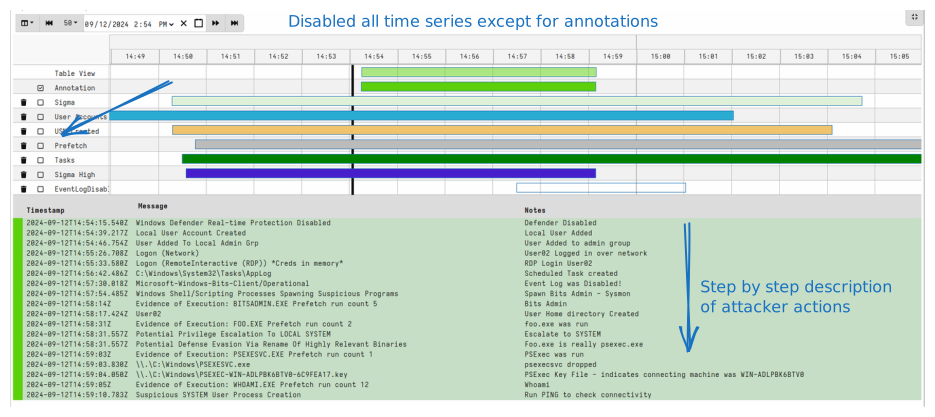
Exporting the annotations
Once we annotated the timeline we can export the annotations in a
table for reporting purposes. The Timeline notebook template
provides a second cell that when recalculated exports the Annotation
time series into a unique table.
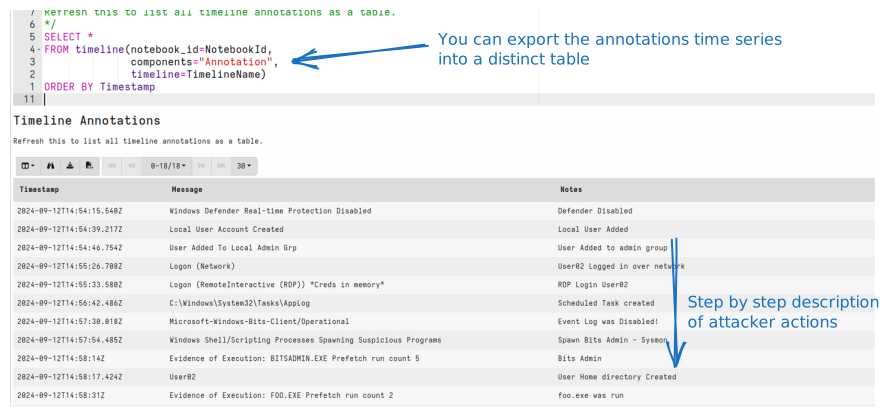
I now can see what the attackers did. Once they logged in as
Administrator, they Disabled Windows Defender, Added a second admin
user account. Then they logged in as that account, created a scheduled
task for persistence, disabled the Bits client logs and then
downloaded PsExec.exe renamed to foo.exe. Finally the attackers
ran whoami and used ping to establish network connectivity.
The Timeline workflow
To summarize, the general workflow is illustrated below
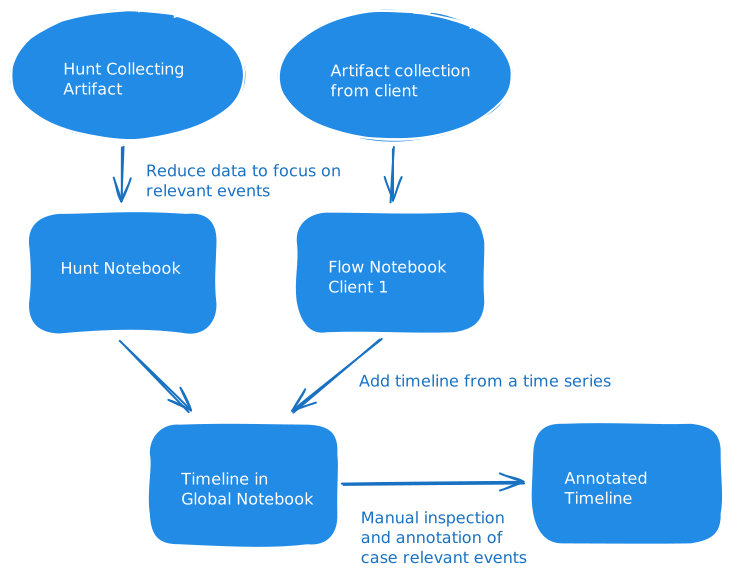
As we collect artifact from a group of hosts in a hunt, or individually from specific clients, we post process the results in order to identify high value events.
The aim is to reduce the total number of events that are added to the timeline in order to make it easier to review them.
Ultimately the product of the timeline exercise is to simply obtain
the Annotation time series. This contains the manually reviewed and
annotated set of events to explain the progression of the incident.
Integration with third party timelining tools
Since the timeline workflow is so central to DFIR there are a number of popular timelining tools out there. Probably the most popular is Timesketch - a collaborative timeline analysis tool developed by the DFIR team at Google.
Many people use Timesketch in conjunction with Plaso which is a timeline based analysis engine for forensic bulk files (e.g. event logs, filesystem metadata etc). The two tools are usually used in a pipeline where Plaso extracts many time related events from various triaged artifacts, storing them in the Timesketch database. This usually results in millions of events - for example each MFT entry contains 16 distinct timestamps, leading to 16 distinct timeline events.
In practice most of these events are not relevant and cloud the analysis process by bombarding the user with many irrelevant events. Users then use Timesketch itself to perform filtering and analysis in order to remove the irrelevant data.
This “Kitchen Sink” approach means that timeline becomes the main tool for filtering and querying large events (with many irrelevant fields). Contrast this with Velociraptor’s “targeted” approach as descried above, where pre-filtering and data shaping/enriching occurs before the data is ingested into the timeline.
We believe that Velociraptor’s “targeted” approach is superior than the “Kitchen Sink” approach, but it does require a mindset shift and for investigators to modify their processes.
Nevertheless, Timesketch is an excellent tool with many users already very familiar with it. Timesketch itself does not actually require Plaso at all and can also be used in a targeted way. In fact it is possible to feed any time series data to Timesketch.
Velociraptor supports integrating with Timesketch using the
Server.Utils.TimesketchUpload artifact. This artifact uploads
Velociraptor’s timelines to Timesketch using the Timesketch client
library. The artifact assumes the client library is installed and
configured on the server.
To install the Timesketch client library:
pip install timesketch-import-client timesketch-cli-clientTo configure the client library to access your Timesketch instance see instructions https://timesketch.org/guides/user/cli-client/ and https://timesketch.org/guides/user/upload-data/
This artifact assumes that the timesketch CLI is preconfigured with
the correct credentials in the .timesketchrc file.
You can use this artifact to manually upload any Velociraptor timeline
data to Timeline by simply specifying the notebook_id, the
supertimeline and the timeline names. The Artifact will prepare
automatically create a sketch if required with the same name as the
Supertimeline, and add a timeline to it with the same name as the
timeline name provided.
Automatic Timesketch uploads
While Server.Utils.TimesketchUpload allows uploading timeline to
Timesketch it requires manual intervention. This makes it more complex
to use and increases friction.
We can automate timeline exports using the
Server.Monitoring.TimesketchUpload server monitoring artifact. This
artifact watches for any timelines added on the server and
automatically exports them to Timesketch in the background. This means
that the user does not need to think about it - all timelines created
within Velociraptor will automatically be added to Timesketch.
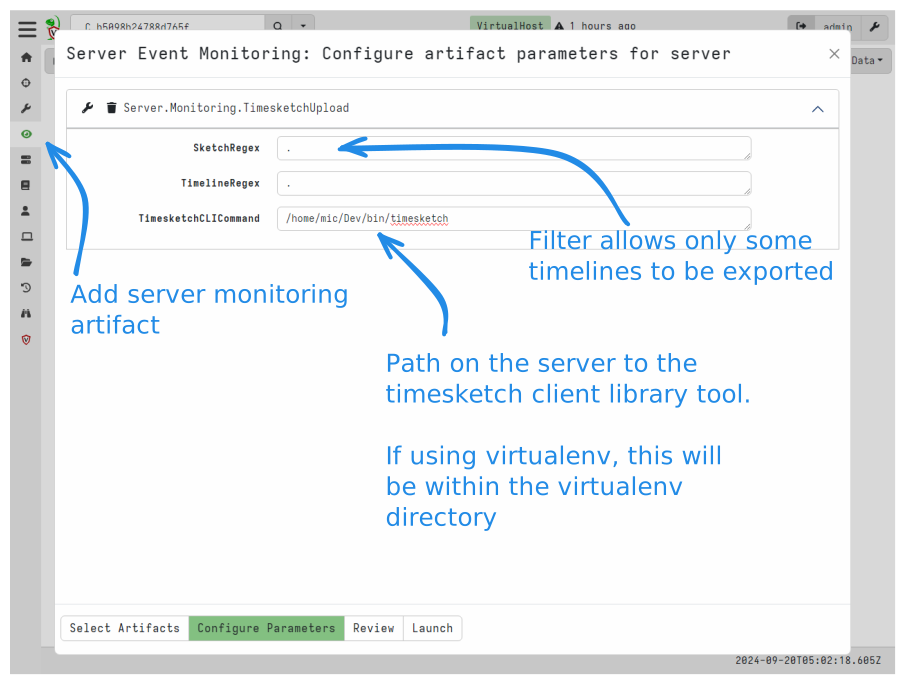
To install the Server.Monitoring.TimesketchUpload server monitoring
artifact, select Server Events in the sidebar, then click the
Update Server Monitoring Table button. Search for
Server.Monitoring.TimesketchUpload and configure its parameters.
The artifact allows for finer control over which timelines to are to
be exported - For example, maybe only timelines with a name that
starts with Timesketch will be exported.
Finally the path on the server to the timesketch client library tool is required - this is the external binary we call to upload the actual data.
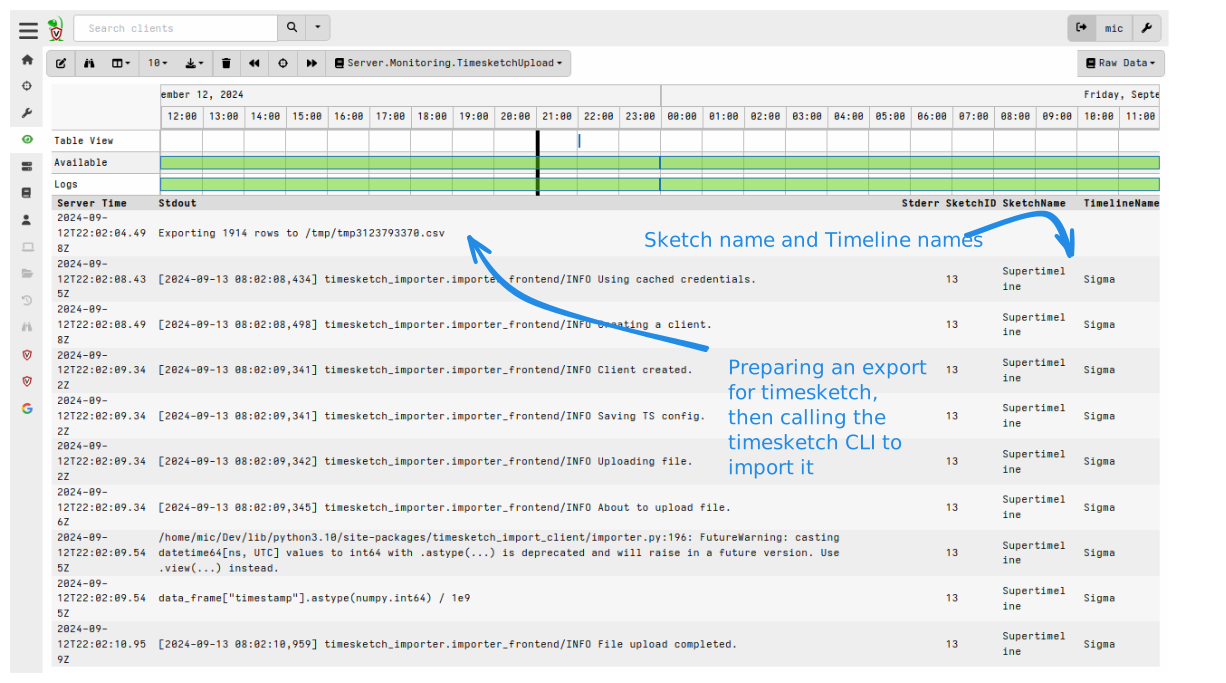
Once the server monitoring artifact is configured it simply waits until a user adds a timeline to a Supertimeline in Velociraptor, as described above. When that happens the timeline is automatically added to Timesketch into a sketch named the same as the Velociraptor Supertimeline.
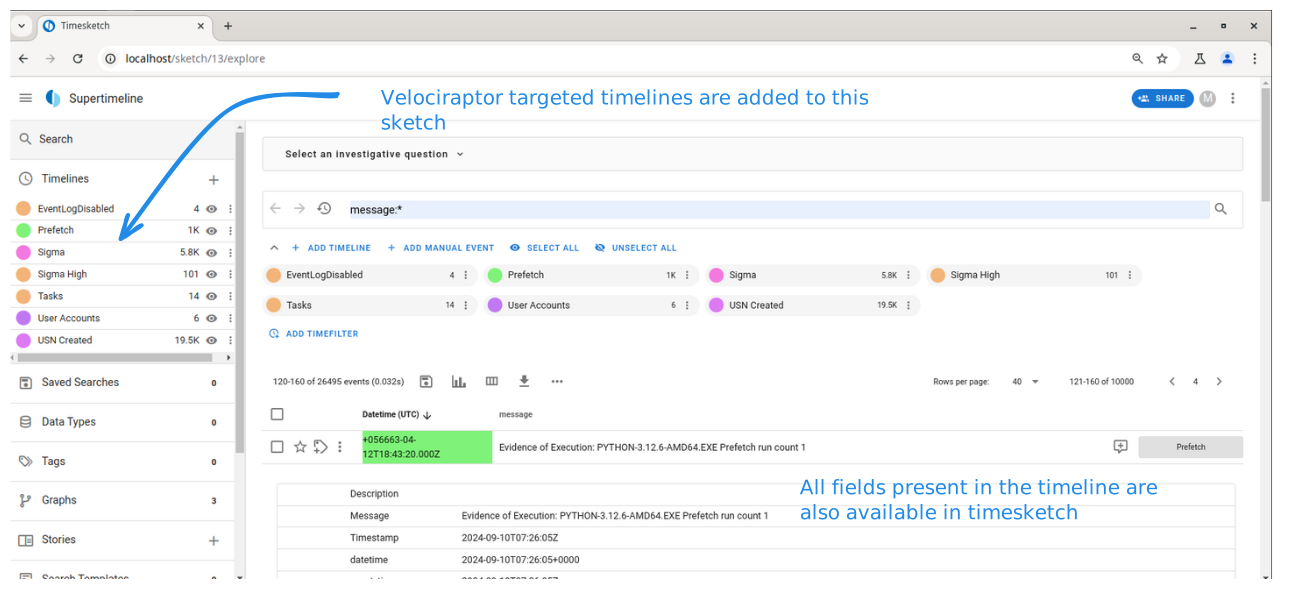
As can be seen in the screenshot above, the same targeted timelines are exported to Timesketch. This is most useful for existing Timesketch users who are wish to continue using their usual timelining tool in a more targeted way by pre-processing data in Velociraptor.
Conclusions
Timeline analysis is an important part of many investigations. The emerging Velociraptor built in timeline feature is a useful tool to assist in the analysis and reporting of incident timelines.
If you like to try this new feature, take Velociraptor for a spin! It is available on GitHub under an open source license. As always please file issues on the bug tracker or ask questions on our mailing list velociraptor-discuss@googlegroups.com . You can also chat with us directly on Discord. .