The Velociraptor process tracker
One of the advantages of running Velociraptor on the endpoint constantly is the ability to monitor the endpoint using client monitoring queries. Gaining visibility to volatile information is critical to reconstructing past activity and responding to new threats.
Commonly, attackers subvert the endpoint by creating new
processes. For example, an attacker might execute malicious office
macros as their initial compromise, but then follow it by launching
PowerShell or C# code - or commonly Living Off The Land binaries
(LOLBins).
We can use information about processes to identify suspicious processes which may represent malicious activity. In the next example I will explore a typical case and how it can be investigated using Velociraptor.
A Typical intrusion
A common lateral movement methodology is using PsExec.exe to create
a system level service (usually remotely). I will run the following commands to emulate typical attacker activities:
psexec.exe /s powershell
ping.exe www.google.com
curl.exe -o script.ps1 https://www.google.com/
notepad.exe
First I create a system level shell with PsExec.exe, then I perform
some reconnaissance on the network. Then I download a tool from a
remote system. Finally I run my malicious process (in this case I use
notepad.exe but in real life this will be some backdoor like Cobalt Strike).
Responding to this system.
For this example, suppose I was able to identify the malicious process
(notepad.exe) using other means (for example the
Windows.Detection.Yara.Process artifact by scanning process memory).
Now I need to get more context about this process:
- Where did it come from?
- Who started it and when?
- What other activity was done around the time the process was started?
To answer the first question we need to see which process was the parent of the malicious process (and construct the full call chain).
For this example I will use Process Hacker - a very popular GUI for inspecting processes.
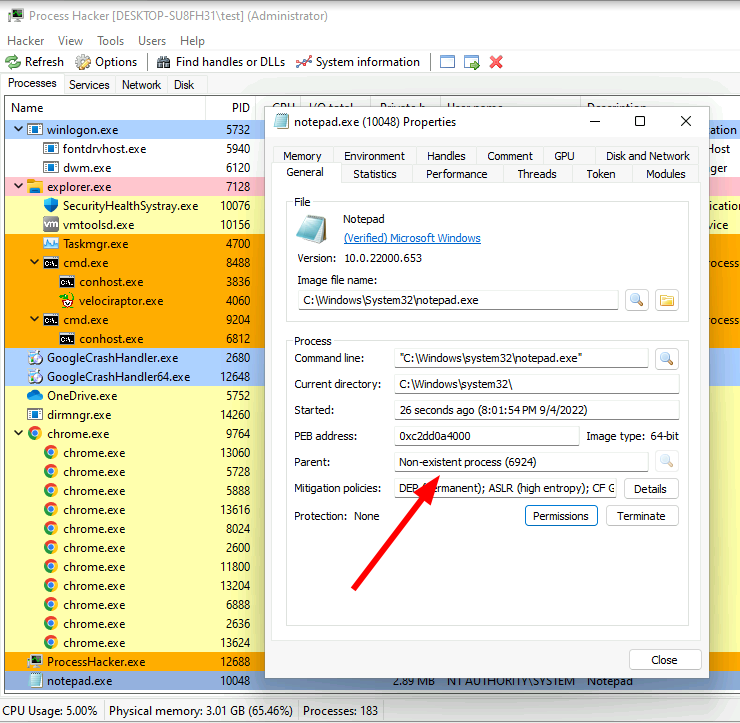
Normally Process Hacker displays processes in a tree form - we can see
which process spawned each process. But in this case, there is no
parent shown for notepad.exe. Closer inspection shows that the
parent process has actually exited, so Process Hacker has no further
information about it.
This limitation of process inspection is central to live triage - the API can not provide any information about processes that have already exited. Therefore, parent/child relationships are broken.
Using Velociraptor to gather process context
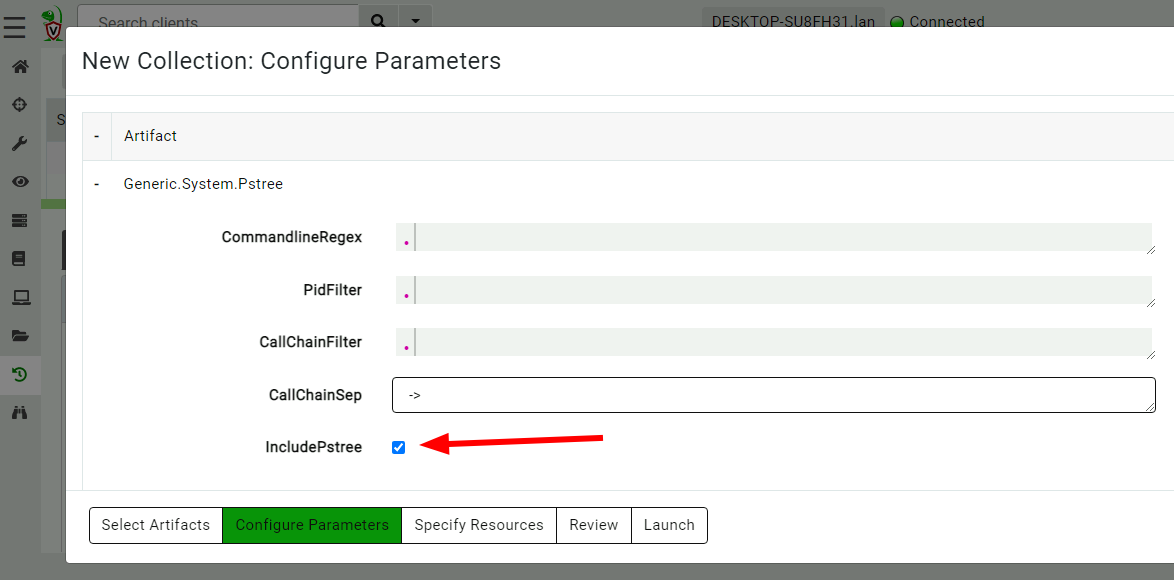
Now, I will use Velociraptor’s Generic.System.Pstree artifact to
reconstruct the process call chain of all processes on the system. I
will enable the collection of the process tree visualization.
The artifact collects process call trace information from all
processes by following their parent/child relationships. I now filter
the table to just show the notepad.exe process, and see that the
process call tree looks very suspicious!
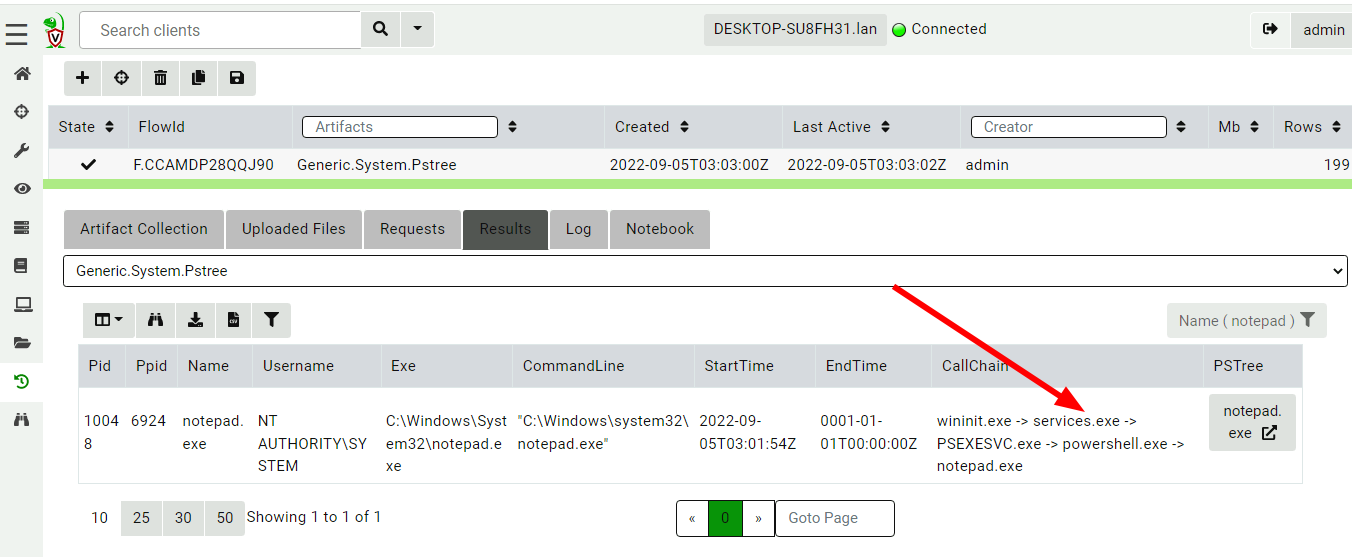
Velociraptor’s Generic.System.Pstree artifact clearly shows the full
call chain - the process was started through a PSEXESVC.exe service
and powershell. This additional context shines light on the initial
intrusion pathway.
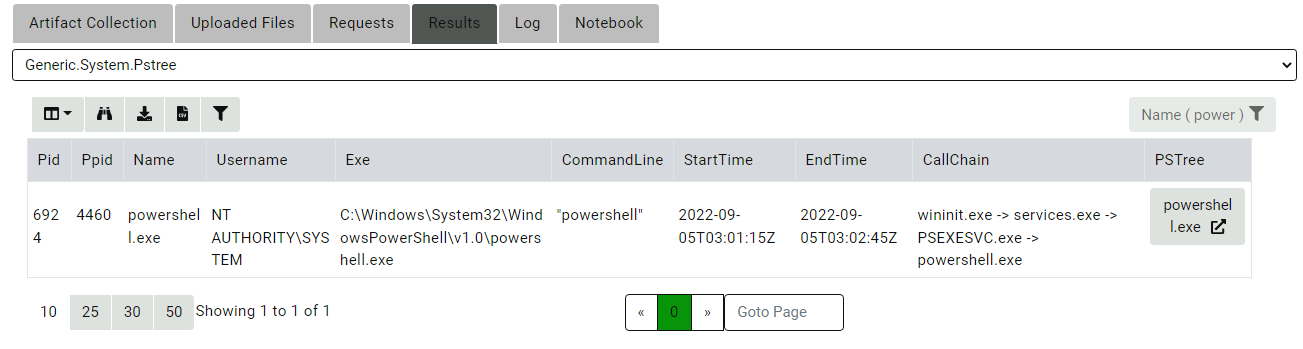
Viewing sibling processes
Launching notepad.exe is the final stage of a more complete attack
chain. Let’s inspect the parent process in our PsTree collection
(powershell.exe) to learn what other sibling processes (to our
suspicious notepad.exe) were launched as part of the original attack
chain.
Clicking the Process Tree button brings out the new Process Tree
visualization - rendering all the children of the powershell and their
respective children.
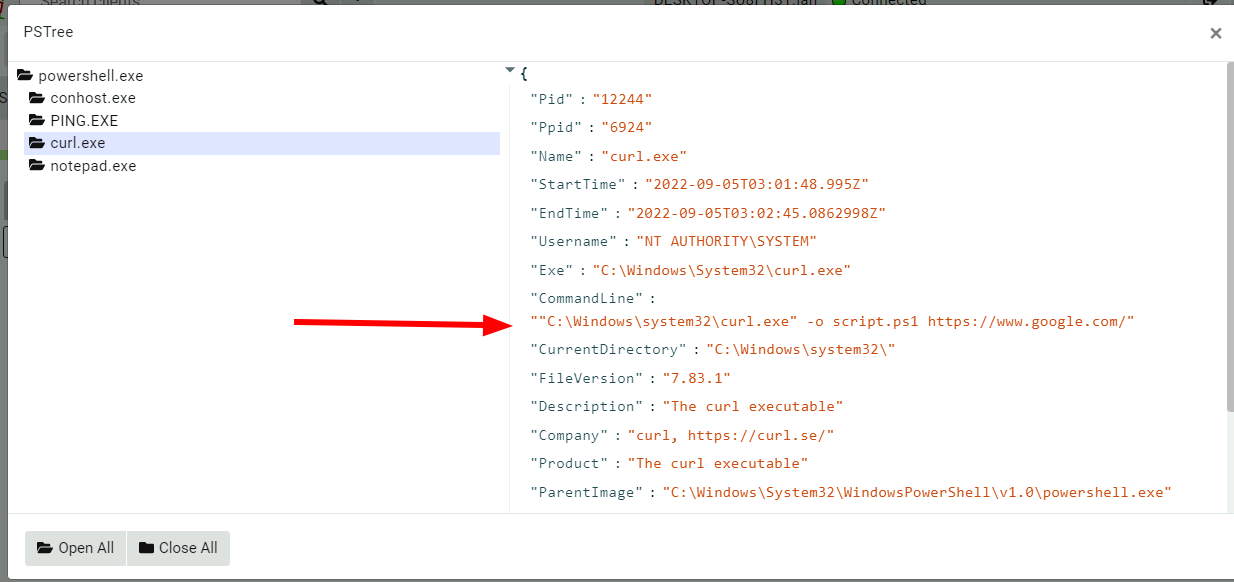
As can be clearly seen from this visualization, Velociraptor reports
seeing the ping.exe process first, then the curl.exe process and
finally the notepad.exe process. You might also notice that
curl.exe as shown in the visualization has already exited by the
time the process tree was collected!
How can Velociraptor show the complete process call chain?
The process call chain is very useful for us to gather some important
context but how does Velociraptor know about processes that have
already exited? After all the API will not reveal this information
which is why Process Hacker can not construct the full call chain?
One of the most exciting additions to Velociraptor in recent releases
was the addition of the process tracker. The Process tracker is an
internal tool that keeps track of processes and their children
continuously. By tracking historical process activity on the end point
we can answer questions like Which process launched this Process ID?
quickly, even if the original parent has already exited - we do not
need to rely on the API to gather this information.
The diagram below illustrates how the process tracker works
![]()
The tracker accepts process information from two potential sources:
- An event query to feed it real time process start/end events.
- A VQL query that runs periodically to refresh the complete state of running processes.
These are implemented by way of
-
The
Windows.Events.TrackProcessesartifact uses ETW to watch for the Sysmon Process start events (ID 1) for real time information, as well as periodically running a completepslist()to synchronize its internal state. -
If you do not want to run
Sysmon, you can choose to collect theWindows.Events.TrackProcessesBasicartifact which only refreshes the tracker with a periodicpslist()API call. -
If you do not collect any specialized artifacts to track processes, the tracker will fall back to a regular pslist() based dummy implementation. This will give the same results as before (i.e. it is unable to see previously exited processes) but all process tracker VQL commands work as usual.
This means that as an artifact writer you can always use the process
tracker as a complete substitution to the traditional pslist()
plugin! Depending on how the administrator chooses to do the actual
tracking, your artifact may gain access to more details.
While it is preferable to populate the process start events with live
Sysmon events, it is not strictly necessary. Sysmon feed with provide
a more accurate real time feed of process start events. While the
alternative pslist() style tracking method is very low resource, it
may miss short lived processes.
Accessing the tracker from VQL
The tracker is available for use from VQL using the following VQL plugins:
-
process_tracker_pslist()This plugin is a drop in replacement for thepslist()plugin. If the tracker is enabled it will also contain exited process information. -
process_tracker_callchain()provides the full call chain for a given process ID as an array of process entries. -
process_tracker_get()Looks up a single Process ID in the tracker to return its entry if exists. -
process_tracker_tree()Provides the full process tree rooted at the specified process ID so it can be visualized in the GUI.
Comparing the process tracker to EDR
Collecting process call chains is very central to detection engineering and therefore is an integral feature of many EDR solutions.
Most EDR solutions work by relaying process start events to a central location such as a SIEM and then using database queries to reconstruct the process call chain from historical data. This also allows viewing historical process information.
Velociraptor’s design philosophy is endpoint-centric - rather than forward all the data to a large backend and query across process start events from ALL endpoints, Velociraptor’s process tracker limits the analysis to the process on the endpoint itself. This naturally limits the total number of process we need to track and makes tracking much easier because we do not need to query across the entire data set for all clients.
Process Tracker challenges
The following describes some of the issues in implementation of the process tracker we have found (so far).
Process ID reuse
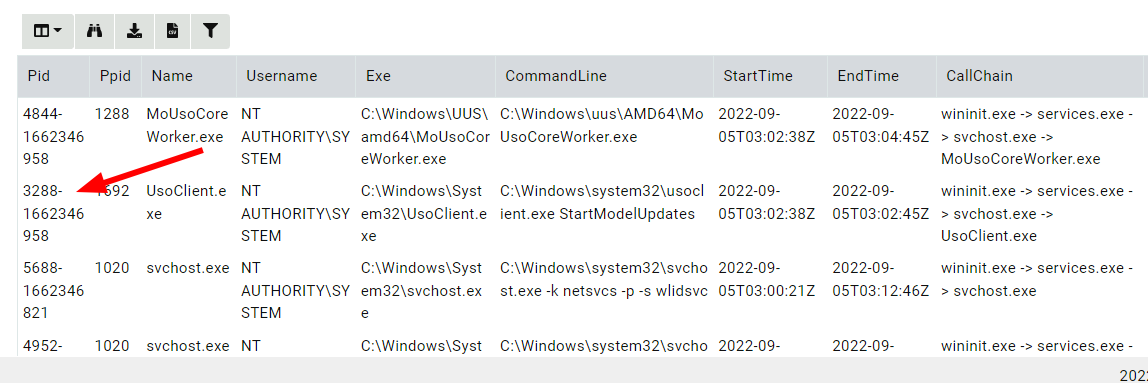
While in theory process IDs uniquely identify a process, in reality (at least on Windows) process ID’s are reused aggressively. Accounting for this is not trivial - For example, if a new process is discovered with a parent ID of 5, we can not just search for a process with ID 5 as it’s parent. Since this ID could have been reused and belong to a completely new process.
Velociraptor’s tracker keeps track of reused process ID’s by using the
combination of process ID and start time to uniquely identify the
process. If the tracker detects a process has exited, it renames the
old process in the form of pid-starttime while creating a new
process entry in the usual form of pid.
Other tools use a unique identifier such as a GUID to uniquely
identify a process. For example, Sysmon derives a GUID based on
process ID, start time, machine id etc to derive a globally unique
identifier to a process.
While a GUID solves the issue of uniquely identifying a process within a single tool it is not a useful device for Velociraptor’s queries, which typically enrich data from external sources.
For example, if we used GUID to uniquely identify processes in the
tracker, a VQL query is unable to enrich the DNS ETW source with
process call chains. The ETW subsystem only provides a Process ID as
an indicator of the process that made the DNS query. There is no way
for Velociraptor to go from a process ID to a unique GUID directly
(precisely because a PID by itself is missing critical data that
makes it a unique identifier).
Therefore Velociraptor’s tracker retains the process ID in the tracker as the ultimate key by which we can query for a process. This way we can always convert a PID to a proper call chain without being confused by PID reuse. When the tracker detects the ID no longer represents the process uniquely (i.e. the PID has been reused) the tracker can update the ID and all references to it automatically, so a search for the same PID will fetch the new process not the old one.
What is stored in the process tracker.
The Velociraptor Process Tracker is simply a database that stores information about each process. The process entry in the tracker can contain any arbitrary data as populated from the process information queries. For example, when using Sysmon as the process start source, we can populate the tracker with quite a lot of additional information such as executable hashes, original executable name etc.
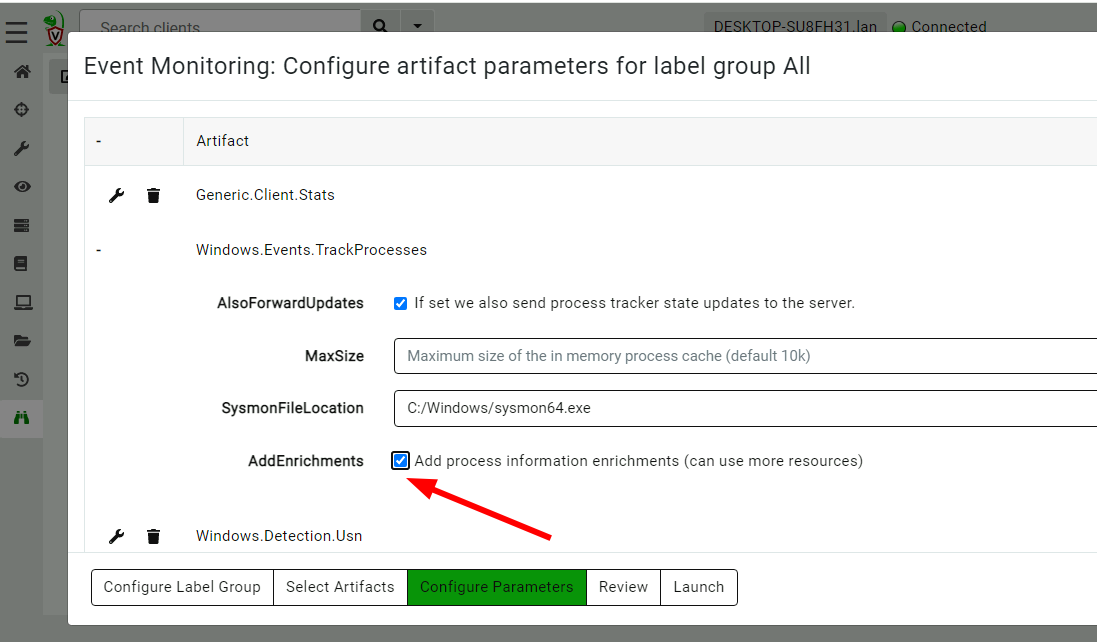
We can choose to add additional enrichment to store in the tracker by
enabling the AddEnrichments parameter when configuring the
Windows.Events.TrackProcesses artifact. These may increase the
overall load on the endpoint (due to the additional work in
calculating hashes etc) but will provide better quality data in a
response.
Conclusions
The Process Tracker is a very exciting feature and can help resolve incidents quickly by providing invaluable context. However it is only useful when Velociraptor is constantly running on the endpoint. If you usually use Velociraptor’s offline collector to just collect a point in time snapshot the process tracker will not be able to provide information about exited processes.
If you like the new process tracker feature, take Velociraptor for a spin! It is a available on GitHub under an open source license. As always please file issues on the bug tracker or ask questions on our mailing list velociraptor-discuss@googlegroups.com . You can also chat with us directly on Discord. .