Event Tracing for Windows Part 1
Digging into Windows Internals
One of the most important aspects of modern operating systems is instrumentation of the running software on the system. Instrumentation provides the visibility to understand what the system is doing at any given moment. This is obviously important for system administrators and software developers, but visibility into machine state is increasingly being used for security monitoring and response.
In Windows, system instrumentation is provided by the Event Tracing For Windows (ETW), an extensive framework for instrumentation and visibility.
Much has been written about ETW so I will not cover the details here, this blog post is the first of a series of posts that examine how we can leverage ETW for security monitoring using Velociraptor specifically.
Event tracing for windows.
The Event Tracing for Windows framework is documented extensively by Microsoft. In a nutshell, the framework is designed to facilitate interaction between event Consumers and event Providers.
Velociraptor provides the VQL event plugin watch_etw() to register
Velociraptor as a Consumer. If you have not read about
Velociraptor’s event queries, check out the
documentation. In
Velociraptor, event queries allow us to write real time monitoring
rules on the endpoint, then forward events to the server, enrich the
event with other information or respond to the event autonomously.
In this blog post we will go through some examples to illustrate the general technique but there are so many possibilities for advanced detection rules.
Exploring ETW - Monitoring DNS lookups
In this blog post, we will be building a Velociraptor query to monitor for DNS lookups on the endpoint. We mentioned previously that ETW connects providers and consumers, so our first task is simply to find a provider that will provider relevant data.
In this post we explore how you might develop new ETW based queries by discovering new providers and experimenting with novel detection rules.
ETW is designed to be self documented via manifest files, so each
provider in the system can describe what it will provide to some
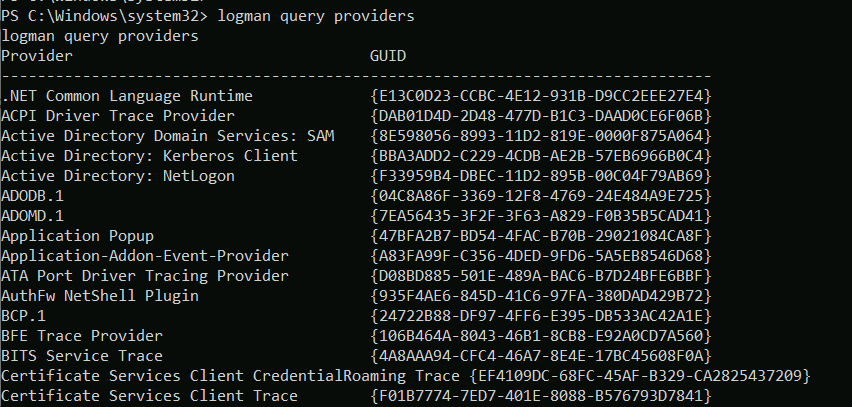
extent. You can see all the providers on your system using the logman query providers command. We can immediately see some providers
identified by the globally unique identifier (GUID).
Although it is possible to query for providers on the command line, using APIs it is possible to dump the entire manifest containing much more information about each provider.
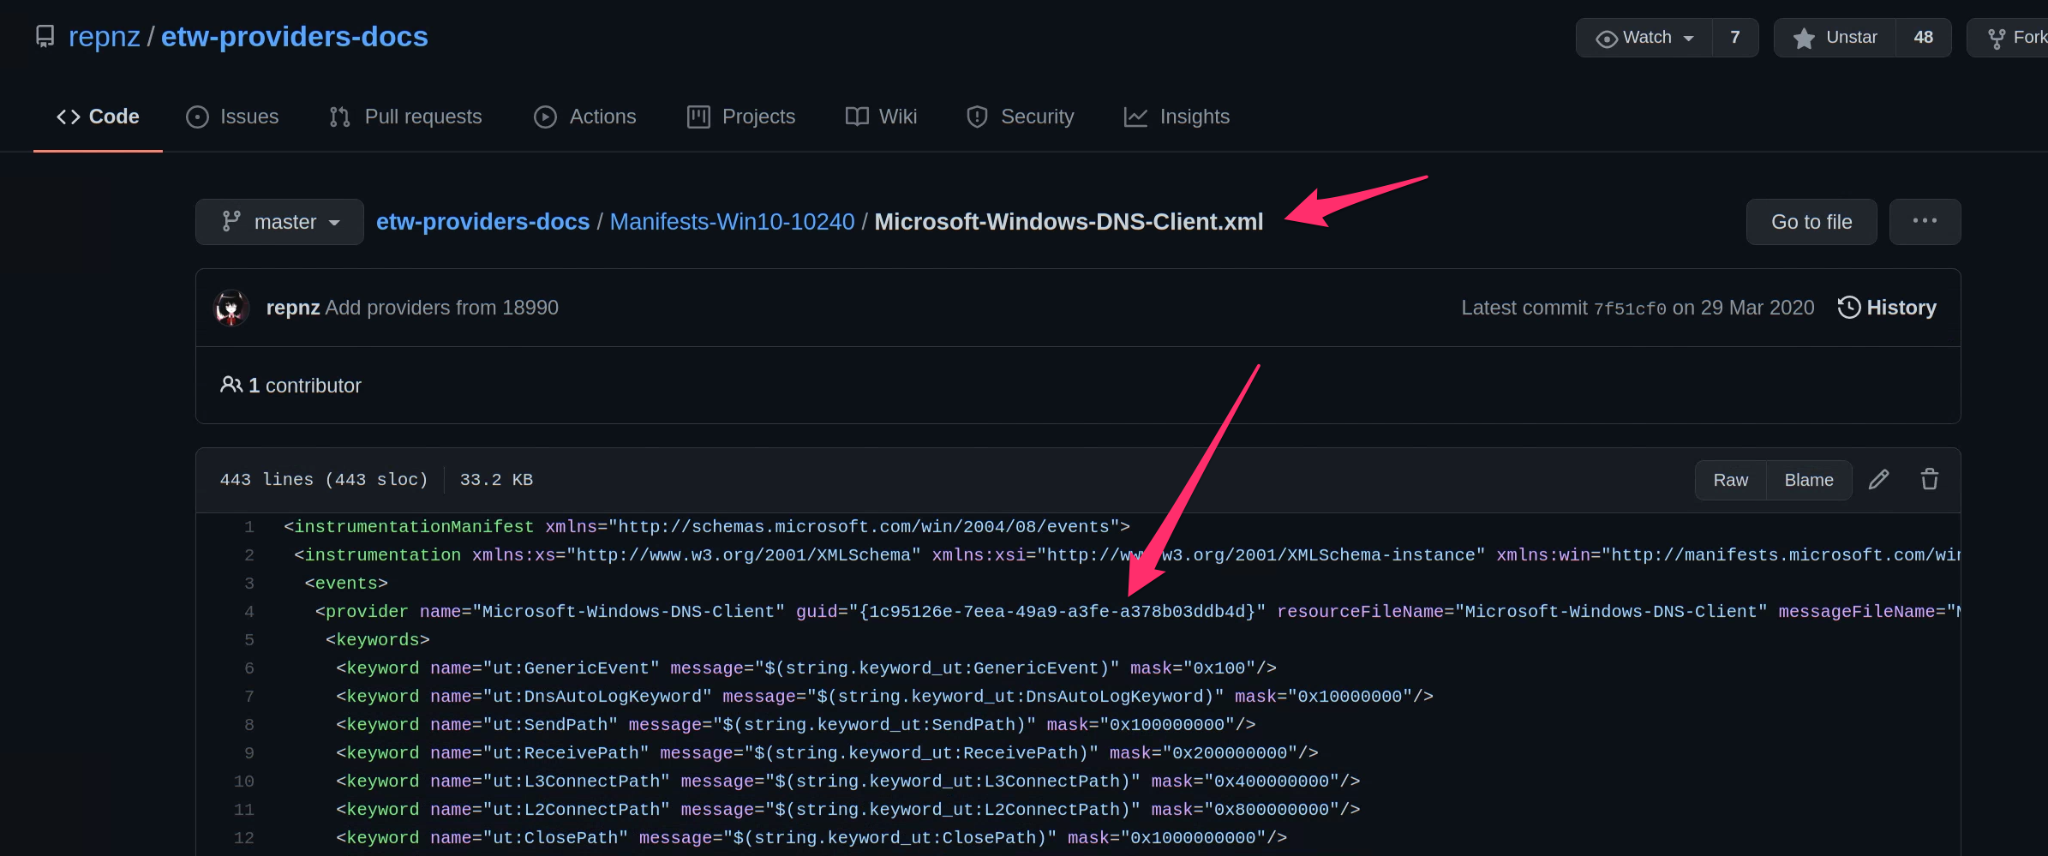
There are some public efforts to better document ETW providers, for
example https://github.com/repnz/etw-providers-docs contains a dump of
various manifest files. I like to search that repository to find
likely useful providers. In this case I will look for a provider that
might give DNS information. The Microsoft-Windows-DNS-Client
provider looks like a likely candidate.
Let’s get Velociraptor to watch the provider’s GUID for any
events. VQL provides the watch_etw() plugin to attach Velociraptor
to the provider.
SELECT *
FROM watch_etw(guid="{1C95126E-7EEA-49A9-A3FE-A378B03DDB4D}")
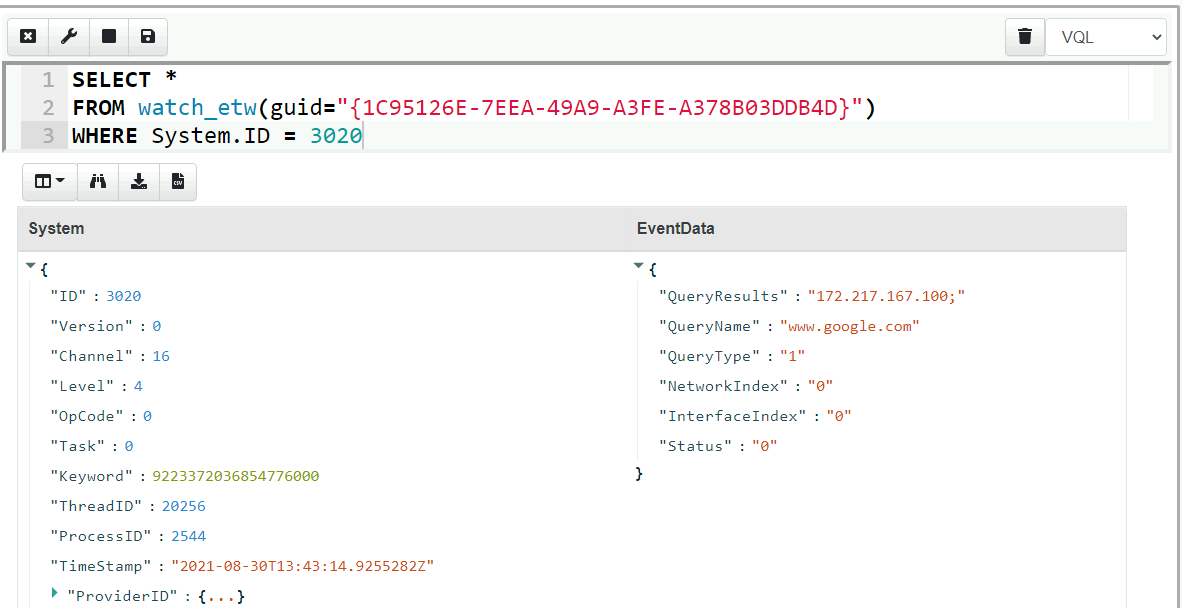
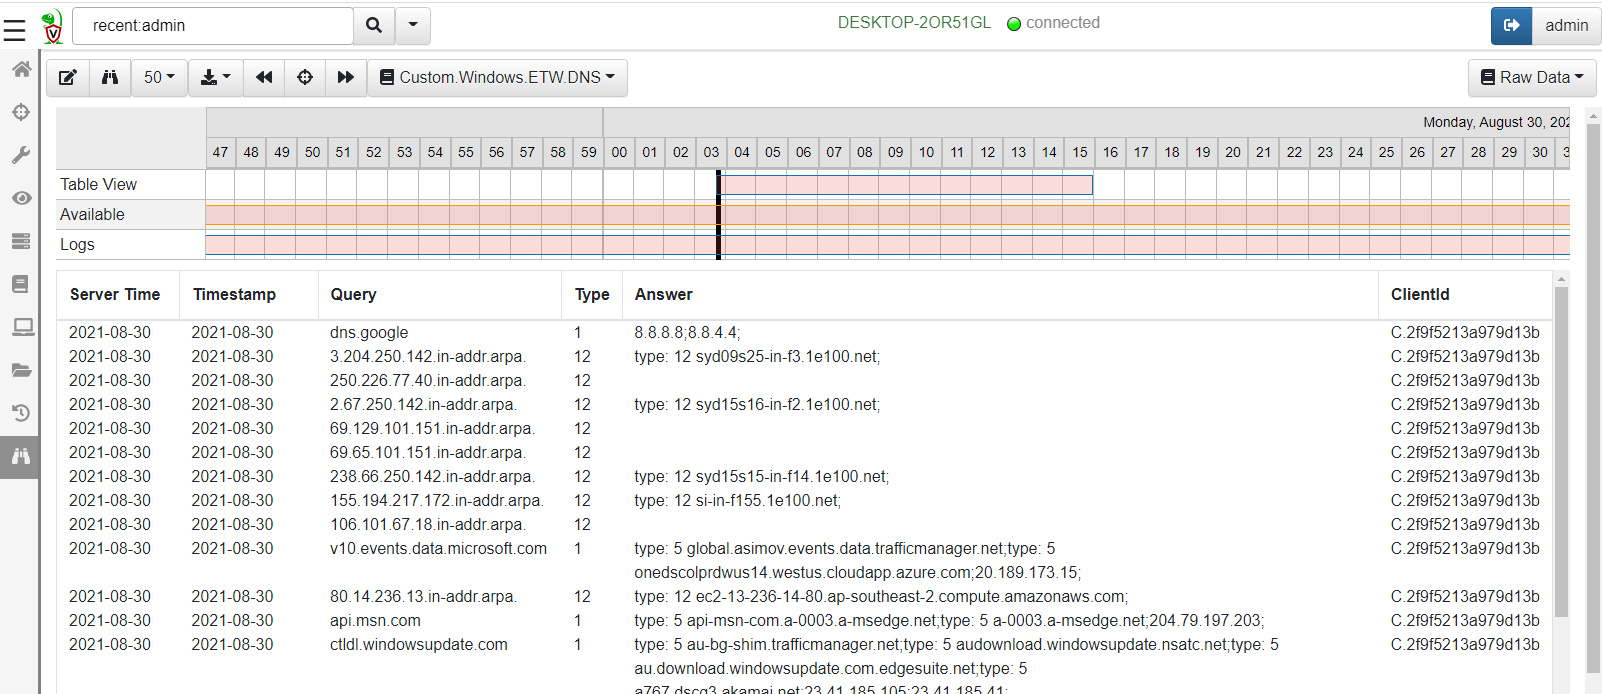
After some trial and error we find the event ID we are interested in as being ID 3020. We can consult with the manifest file to get more information, such as the event data provided. Limiting the VQL query to filter for event 3020 and extracting the most relevant columns gives a nice DNS monitoring query:
SELECT System.TimeStamp AS Timestamp,
       EventData.QueryName AS Query,
       EventData.QueryType AS Type,
       EventData.QueryResults AS Answer
FROM watch_etw(guid="{1C95126E-7EEA-49A9-A3FE-A378B03DDB4D}")
WHERE System.ID = 3020
Deploying the query on endpoints
Our VQL query is able to monitor the endpoint for DNS lookups but we
need a way to deploy the query to the endpoint. In Velociraptor,
client side event queries are encapsulated in Client Event artifacts
(Simple YAML files that include the VQL query, as well as human
readable descriptions and parameters allowing for simple
customization).
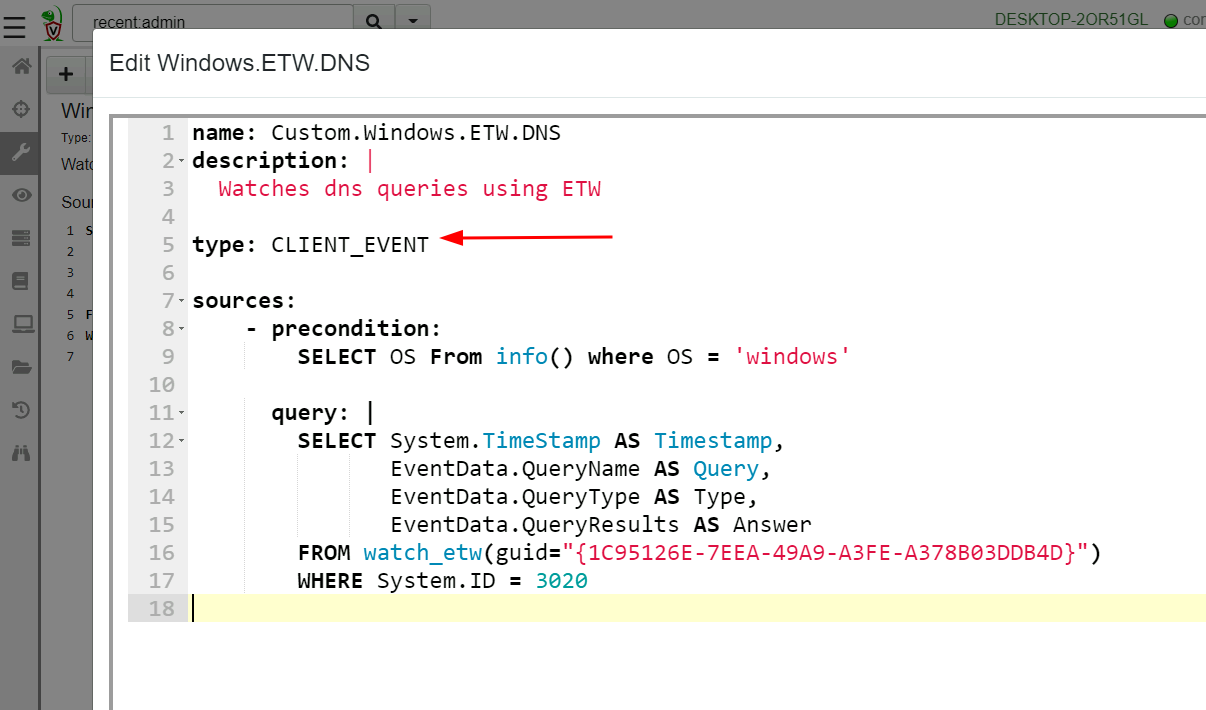
Simply select “Add new artifact” in the View Artifacts screen. By
default Velociraptor presents a template for an artifact definition -
ready for us to fill in the right information. Simply copy the VQL
query into the new artifact under the Sources.Query section
(remember to indent the query to fit within the YAML format). Since
this artifact will be an event artifact running on the client, we must
specify its type as CLIENT_EVENT
What is the difference between a CLIENT and a CLIENT_EVENT artifact?
A CLIENT artifact is collected from the client, by sending a query,
having the client execute the query, returning a result set
(i.e. rows) back to the server. Therefore the CLIENT artifact
normally has a limited lifetime (by default 10 minutes) over which to
complete its work and return a result.
CLIENT_EVENT artifacts are designed to run continuously on the
client, streaming rows to the server when events occur. Therefore
these are treated differently by the client: The client simply records
the event queries it is to run in a Client Event Table.
The client starts running all the event queries when it first starts. If the client table changes on the server (perhaps because the user added a new event artifact to the client), the client will resync its event table and restart all its queries.
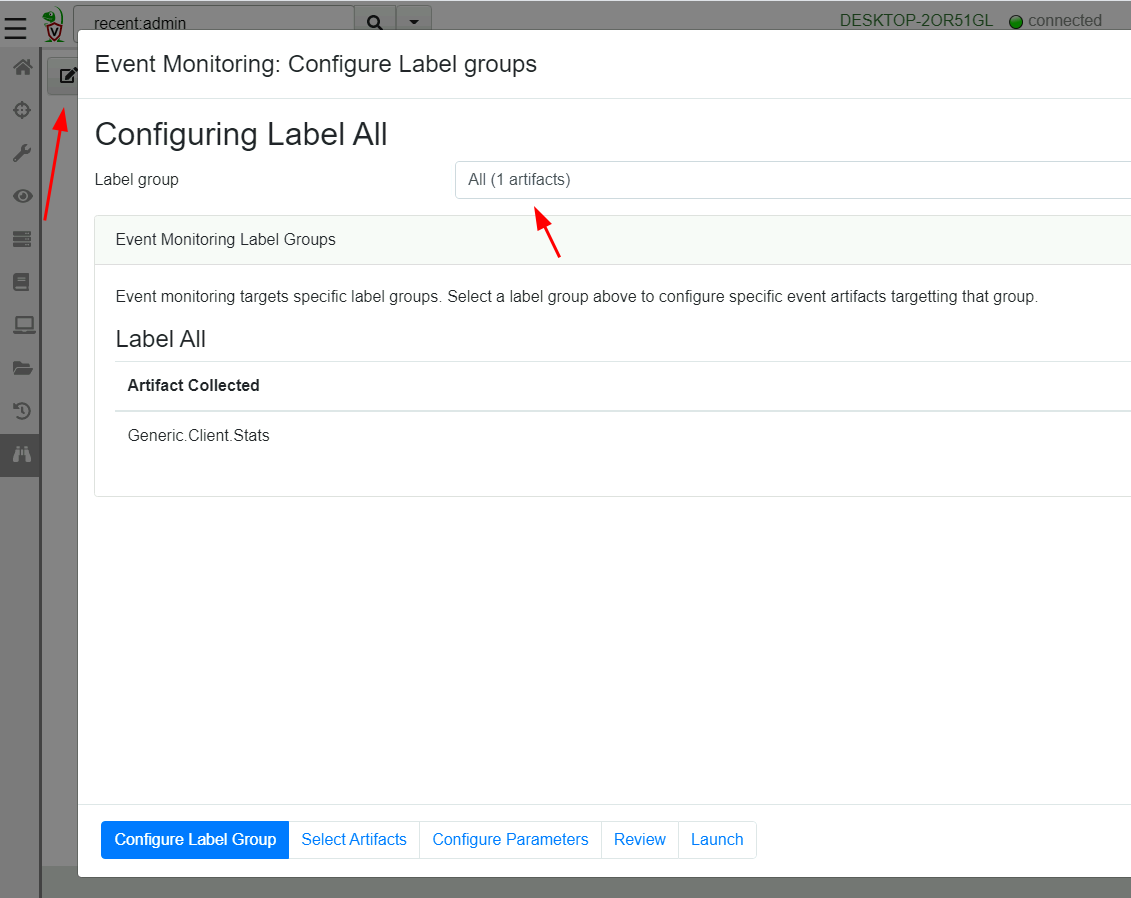
Once Velociraptor contains the new artifact it is time to deploy the
artifact to endpoints. Velociraptor can target different event
artifacts to different clients by means of Label Groups. By simply
assigning a label to a client, we can control the event artifacts
running on the client. For example, some of our endpoints are more
sensitive so we might want to only deploy certain monitoring queries
on those clients only by labeling them as “Sensitive”.
For our example, we will deploy the query on All clients.
Once the query is deployed we can begin seeing any DNS events generated on the endpoint.
Conclusions
Hopefully you were inspired by this post to search for your own detection queries. ETW is a rich source of endpoint state telemetry! There are many other providers to explore and many possibilities of combining ETW with other information sources.
While many users are familiar with Velociraptor’s ability to collect endpoint state and hunt for indicators at scale, the event monitoring capability is a different approach making certain types of detections much more convenient and effective.
For example, many users ask “how do I schedule a hunt to run periodically?” While there are some cases when this is a good solution, in most cases users are trying to find out what has changed in the endpoint’s state between two times.
An event monitoring artifact can inform of state changes on the endpoint and perform the preliminary triage and analysis of these events automatically.
In the next part of this article series we will be examining more examples of utilizing ETW for enhancing end point visibility and facilitating advanced response. We will also be discussing limitations with this technique.
If you have a great idea for a new detection query, take Velociraptor for a spin! It is a available on GitHub under an open source license. As always please file issues on the bug tracker or ask questions on our mailing list velociraptor-discuss@googlegroups.com . You can also chat with us directly on Discord. .
There is still time to submit it to this year’s 2021 Velociraptor Contributor Competition, where you can win prizes, honor and support the entire DFIR community. Alternatively, you can share your artifacts with the community on Velociraptor’s Artifact Exchange.